Analytics
The analytics dashboard gives admins a comprehensive view of program impact. All metrics are calculated from real operational data — actual weights recorded during collections and distributions.
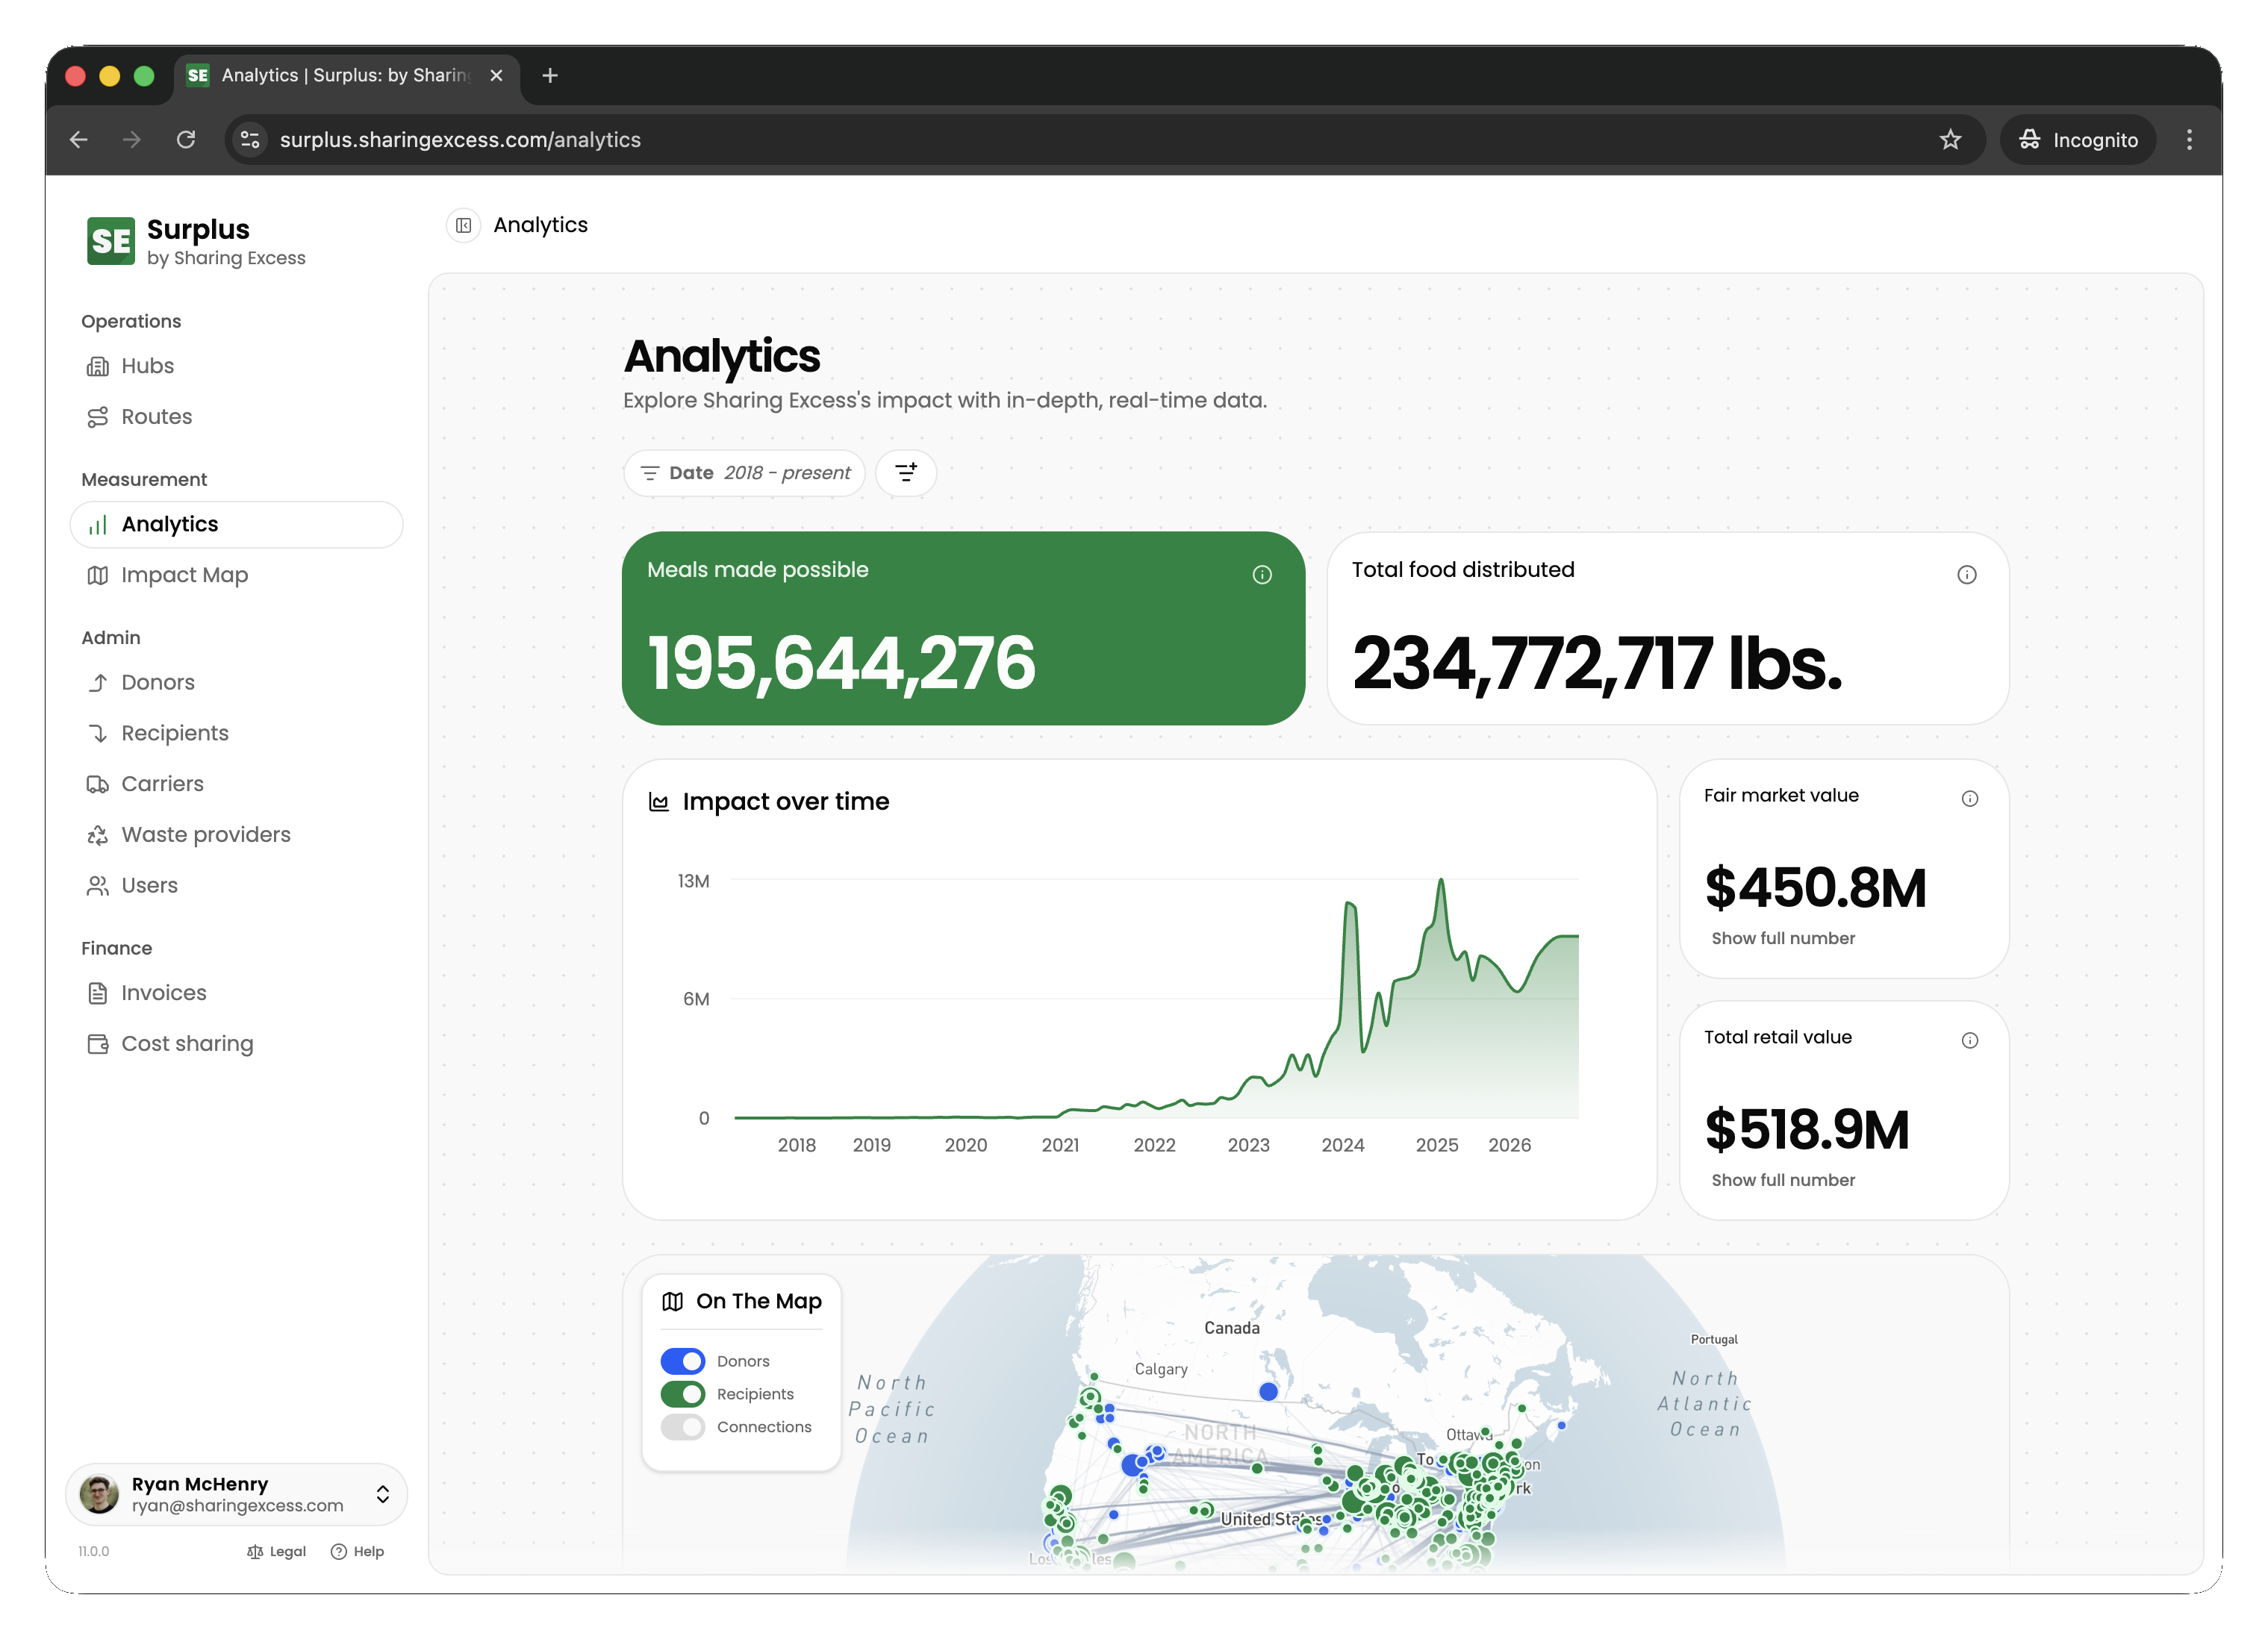
The analytics dashboard
The main analytics view shows headline metrics:
- Pounds rescued — total weight of food distributed to recipients
- Meals made possible — estimated servings based on weight
- Distributions — number of completed distribution events
- Donors — unique donor organizations that contributed
- Recipients — unique recipient organizations served
- Retail value — estimated dollar value based on food categories
- Waste cost savings — estimated disposal costs avoided
Beside the impact-over-time chart, the sidebar shows fair market value and two CO₂e metrics (each as its own card):
- Upstream emissions diverted (CO₂e) — production emissions embodied in rescued food (3.66 lbs CO₂e/lb)
- Downstream emissions prevented (CO₂e) — landfill methane avoided (category-based WARM v16 factors)
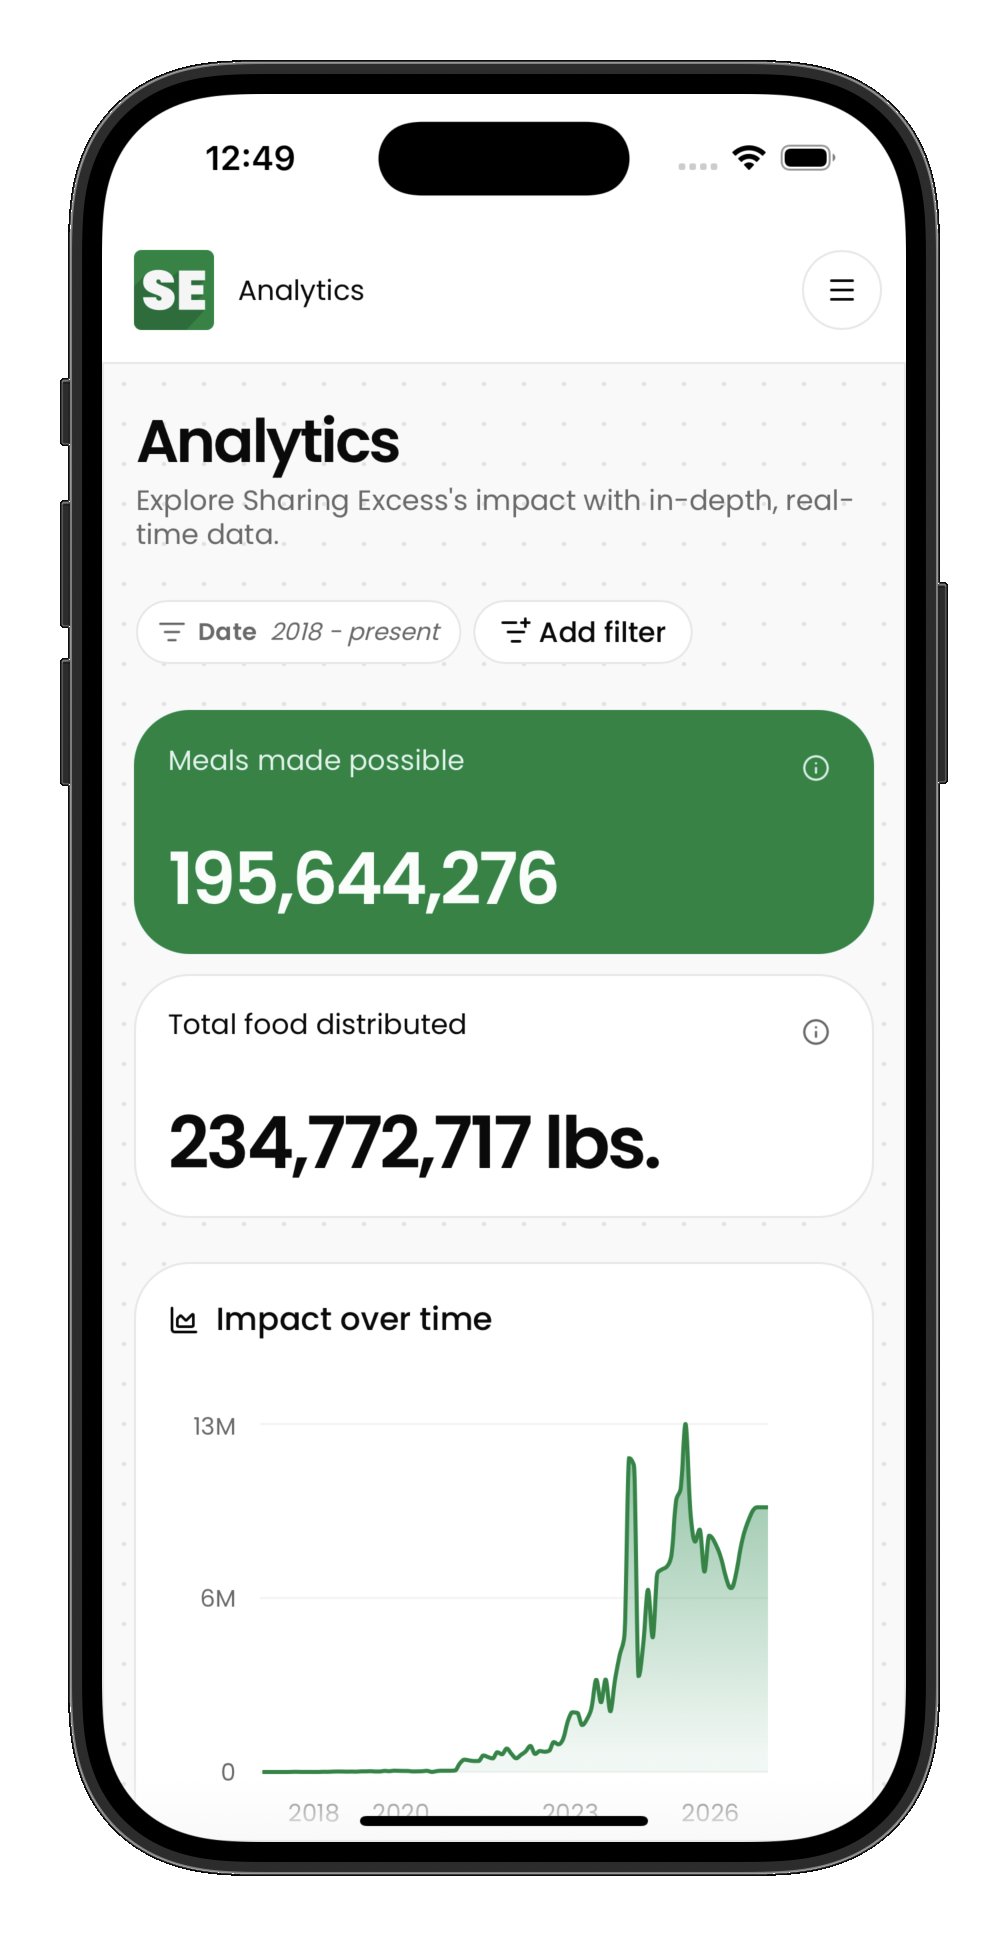
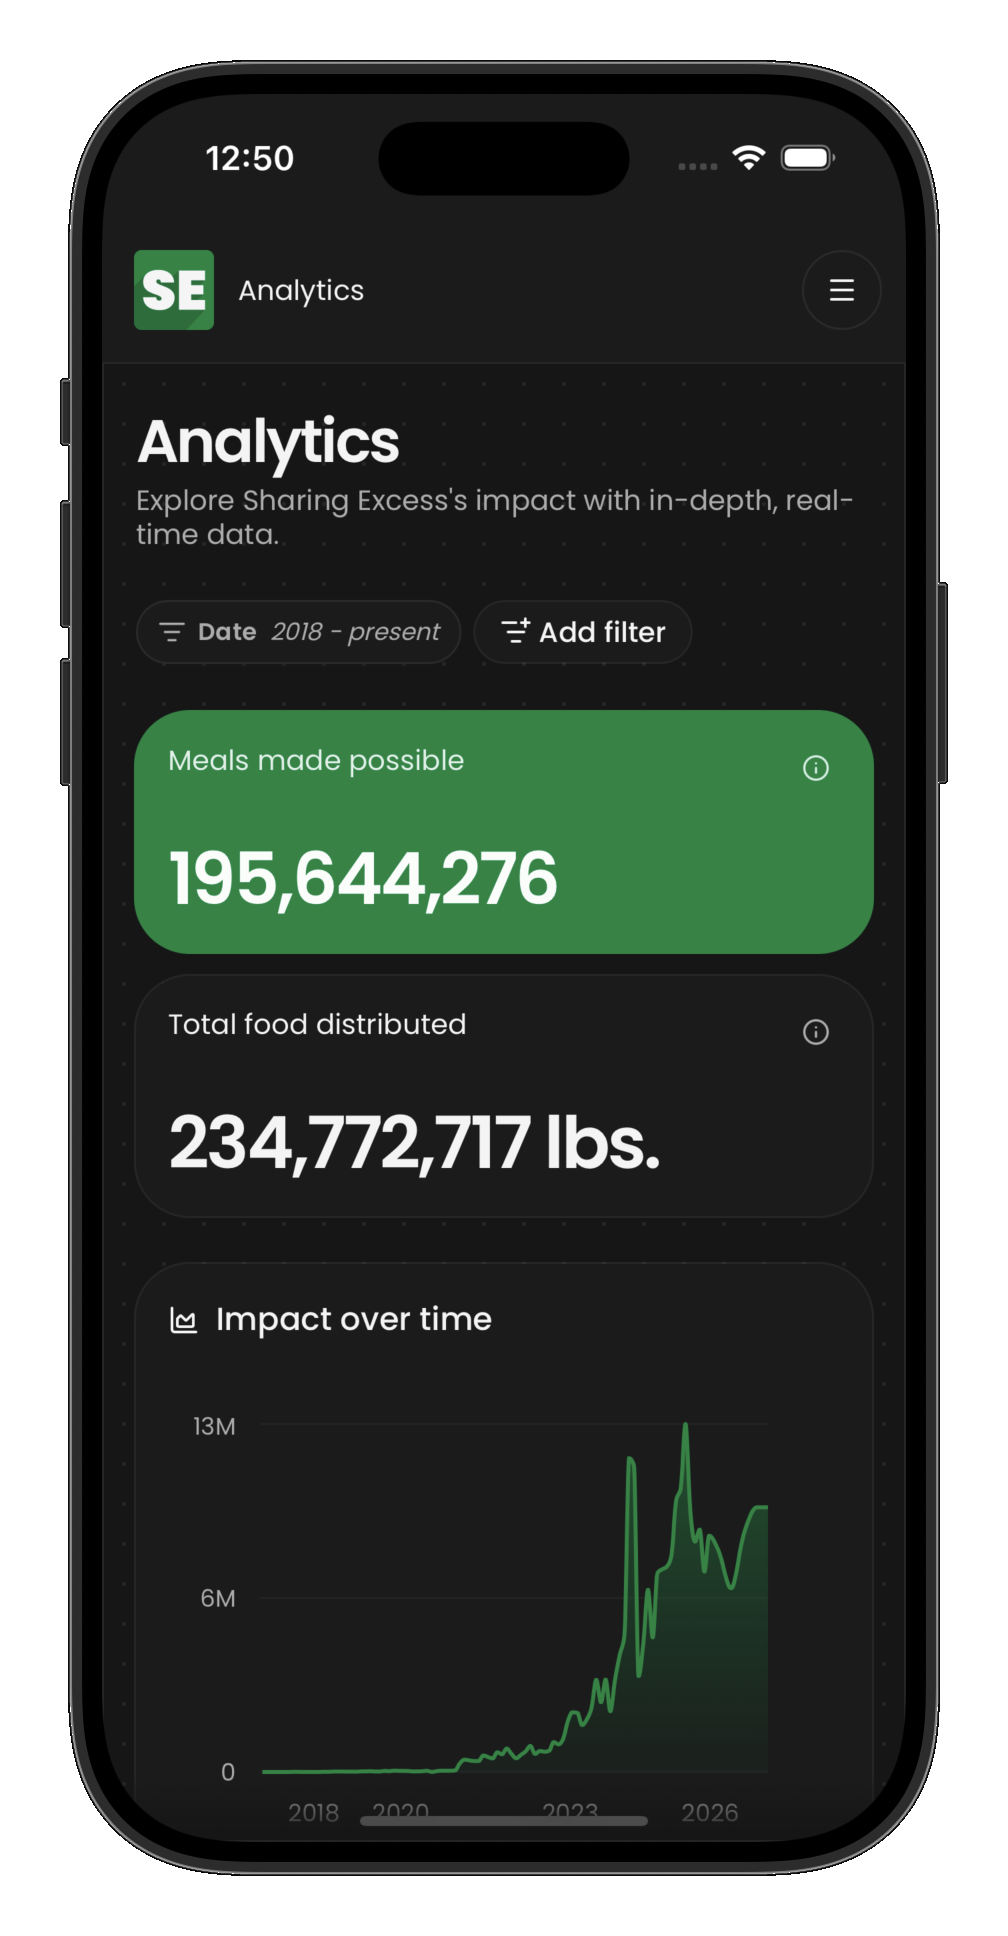
Filtering
The dashboard supports powerful filtering to drill into specific segments:
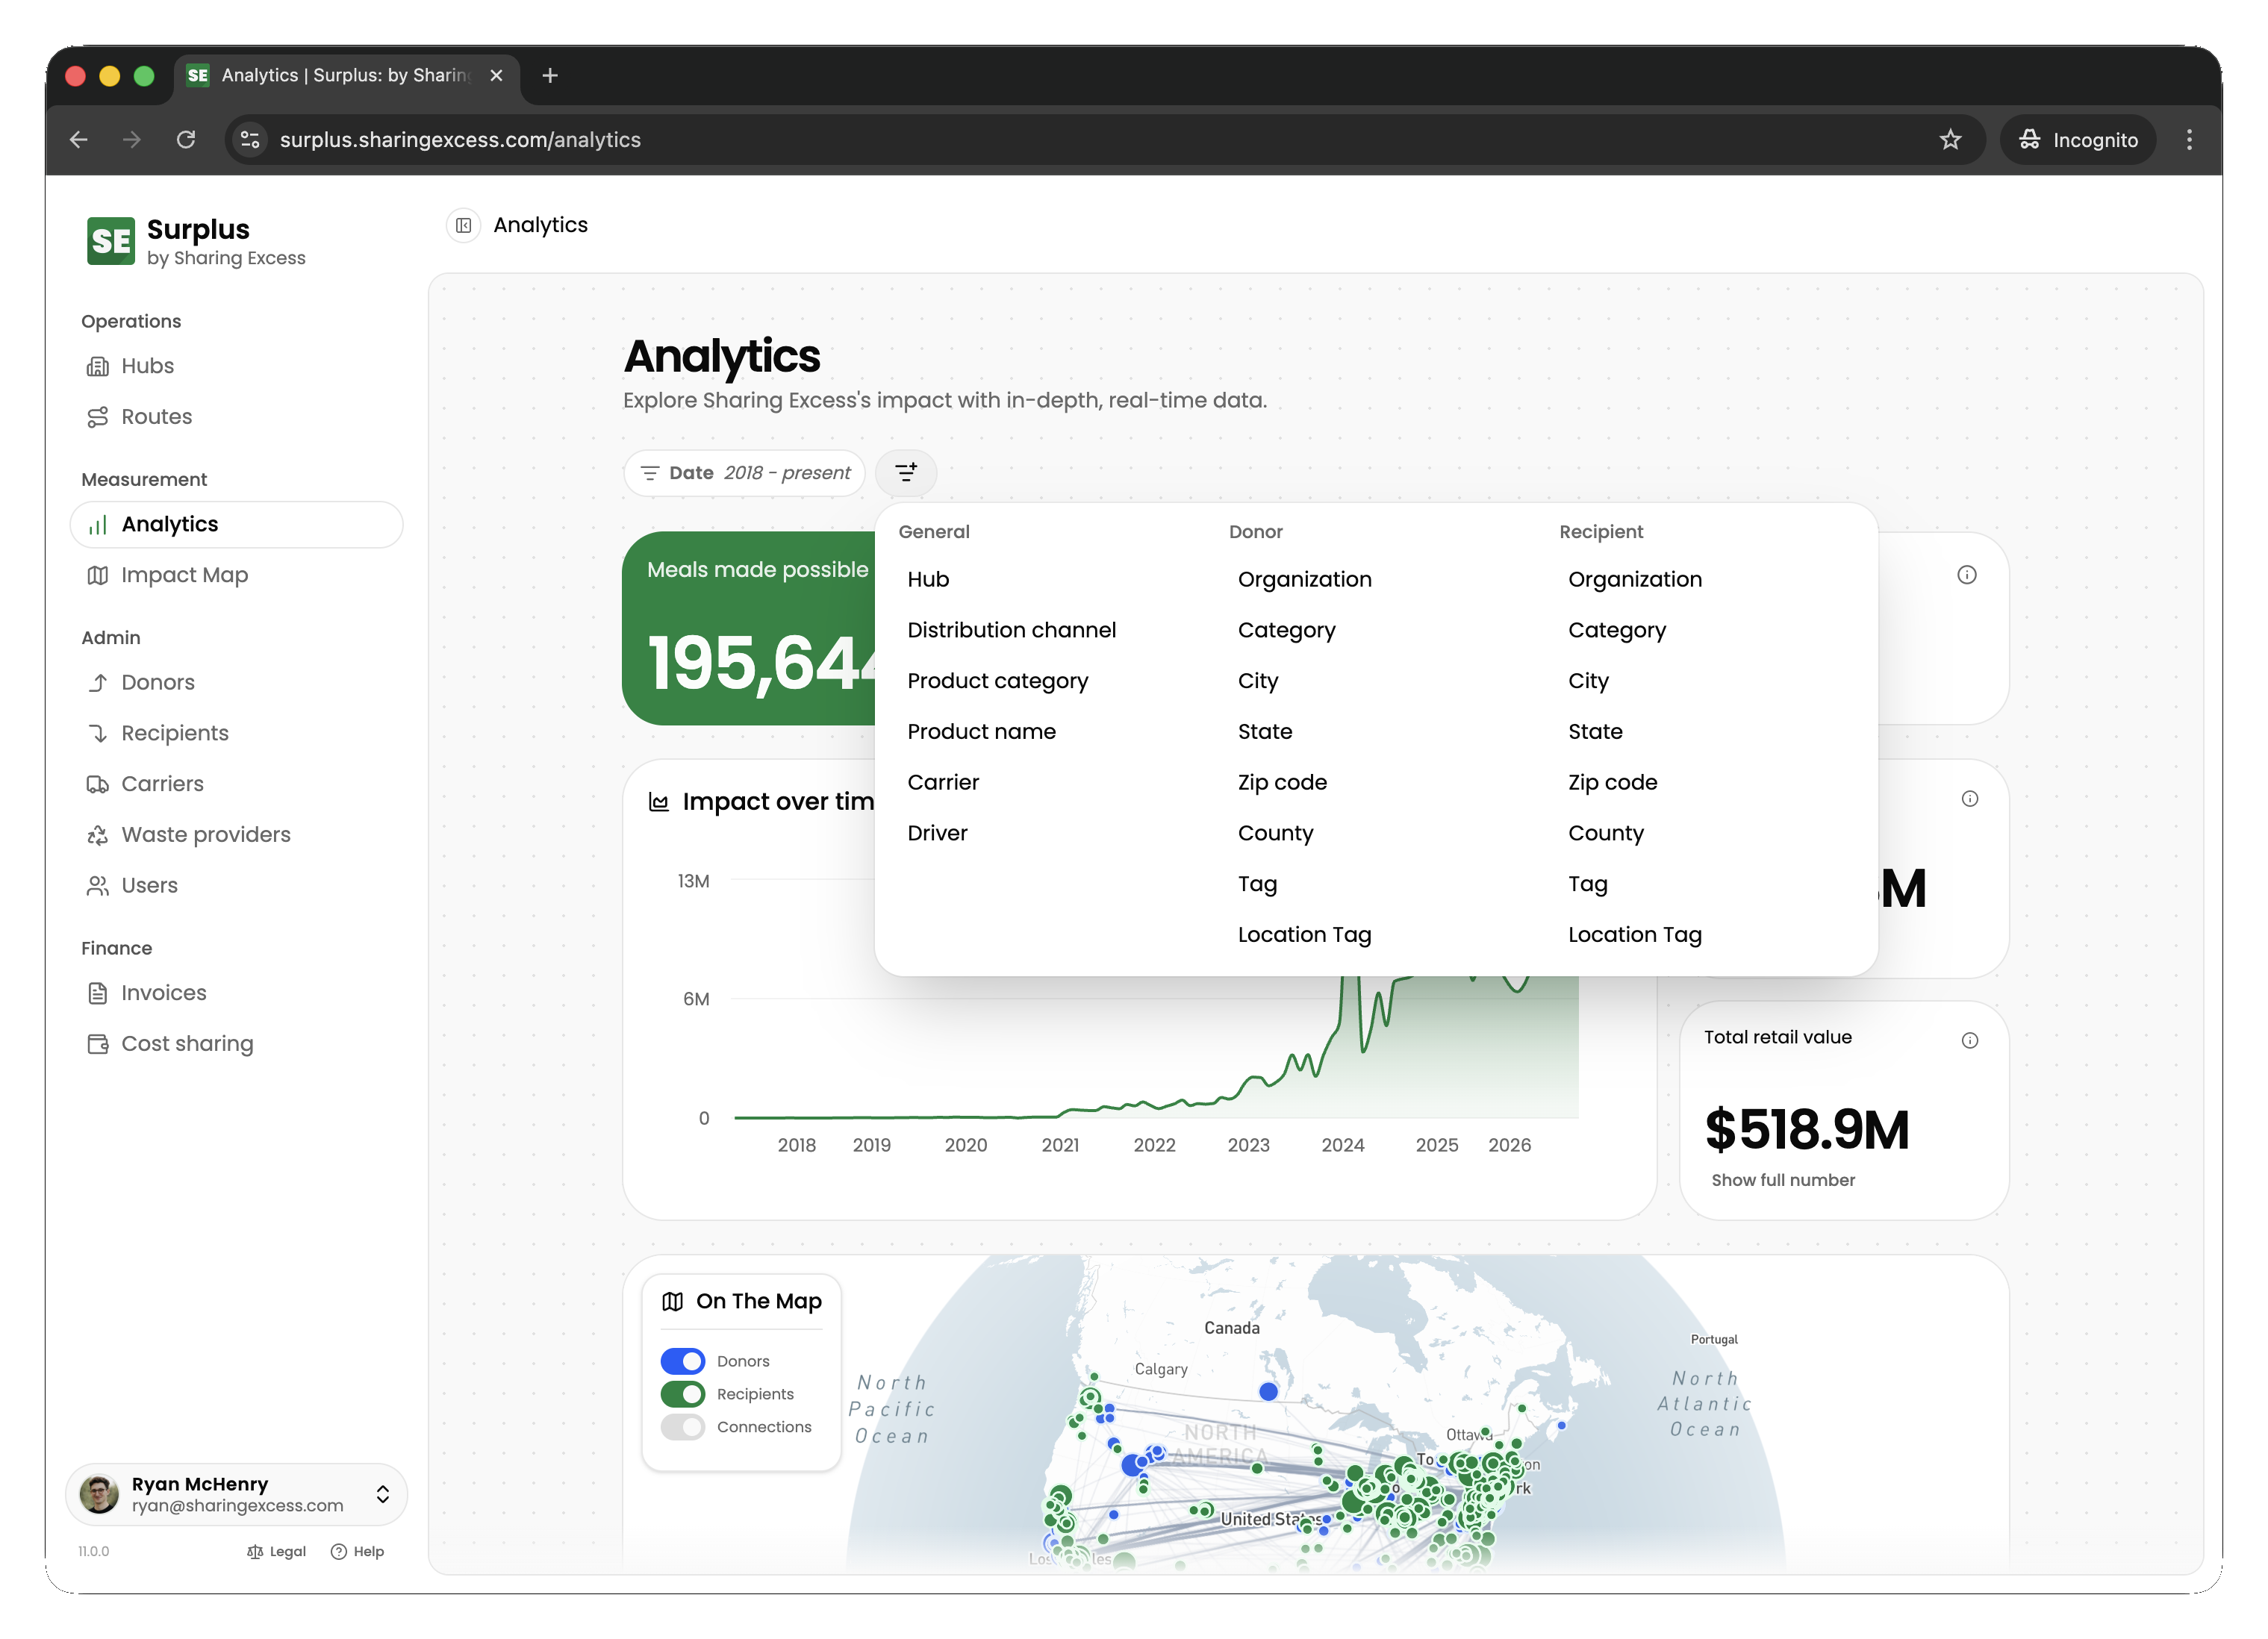
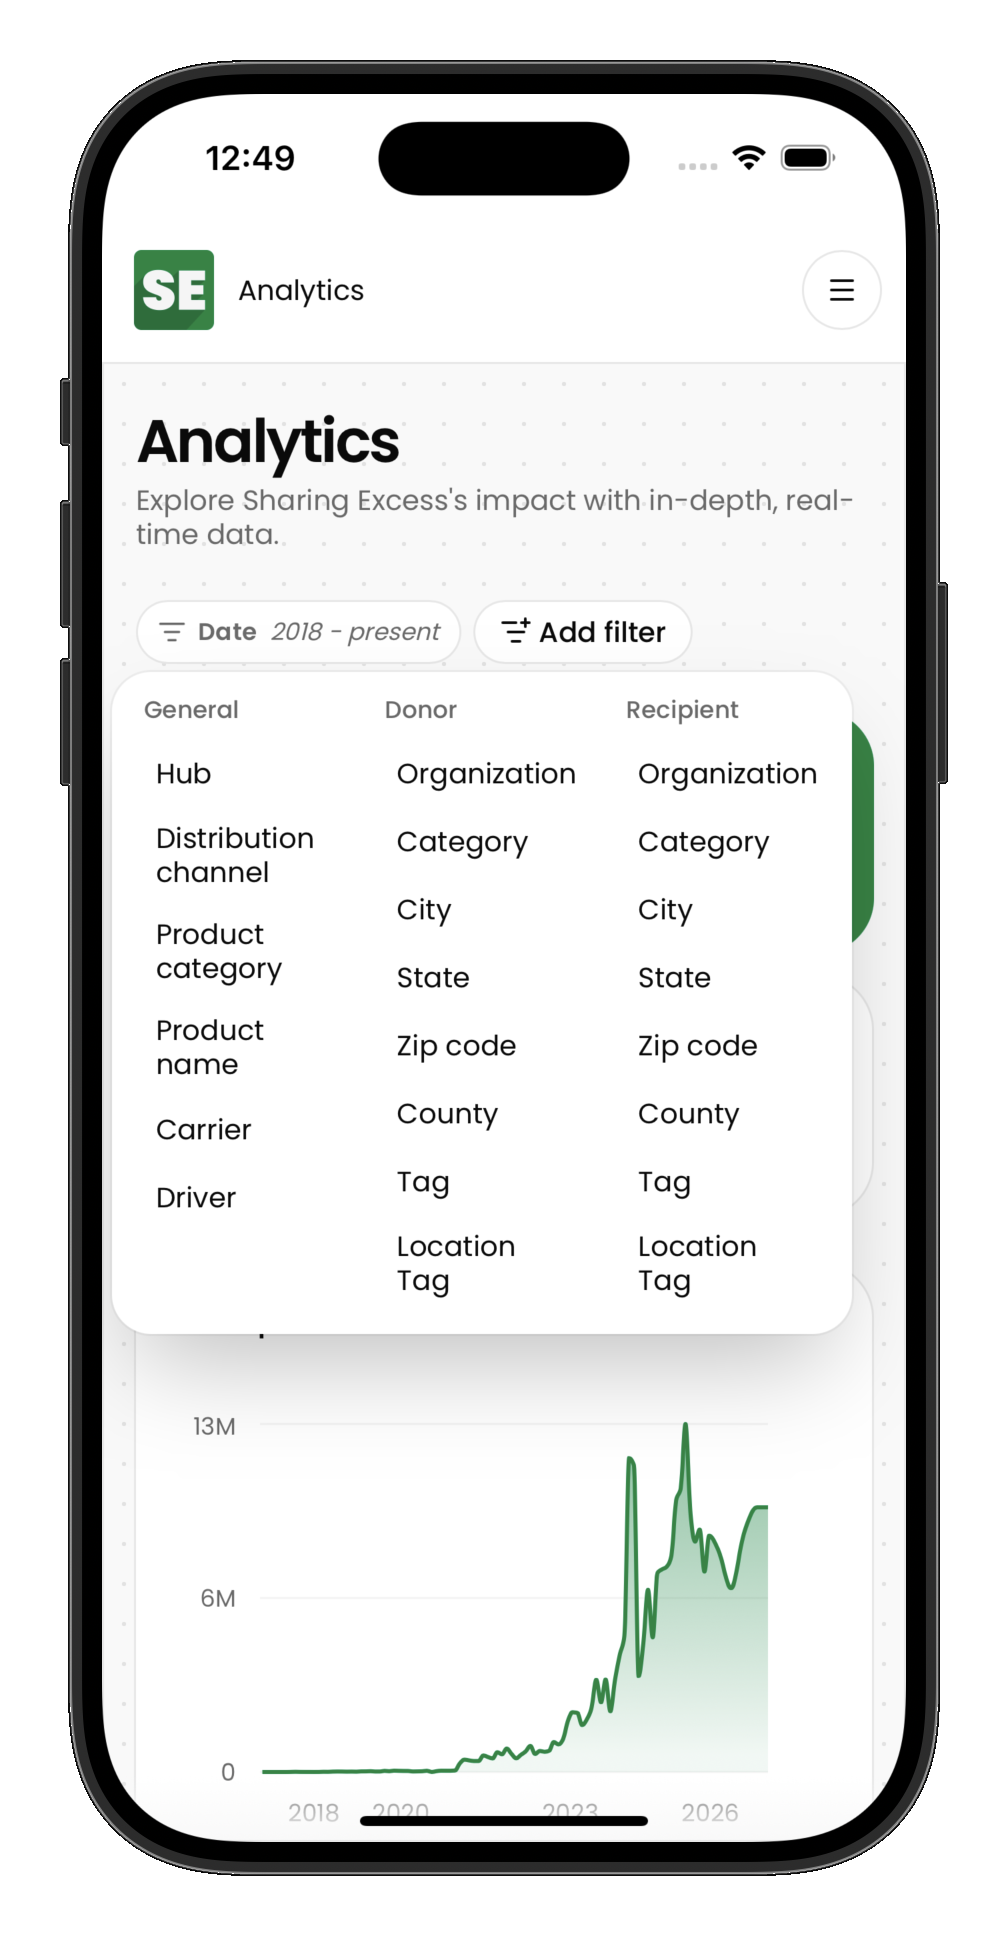
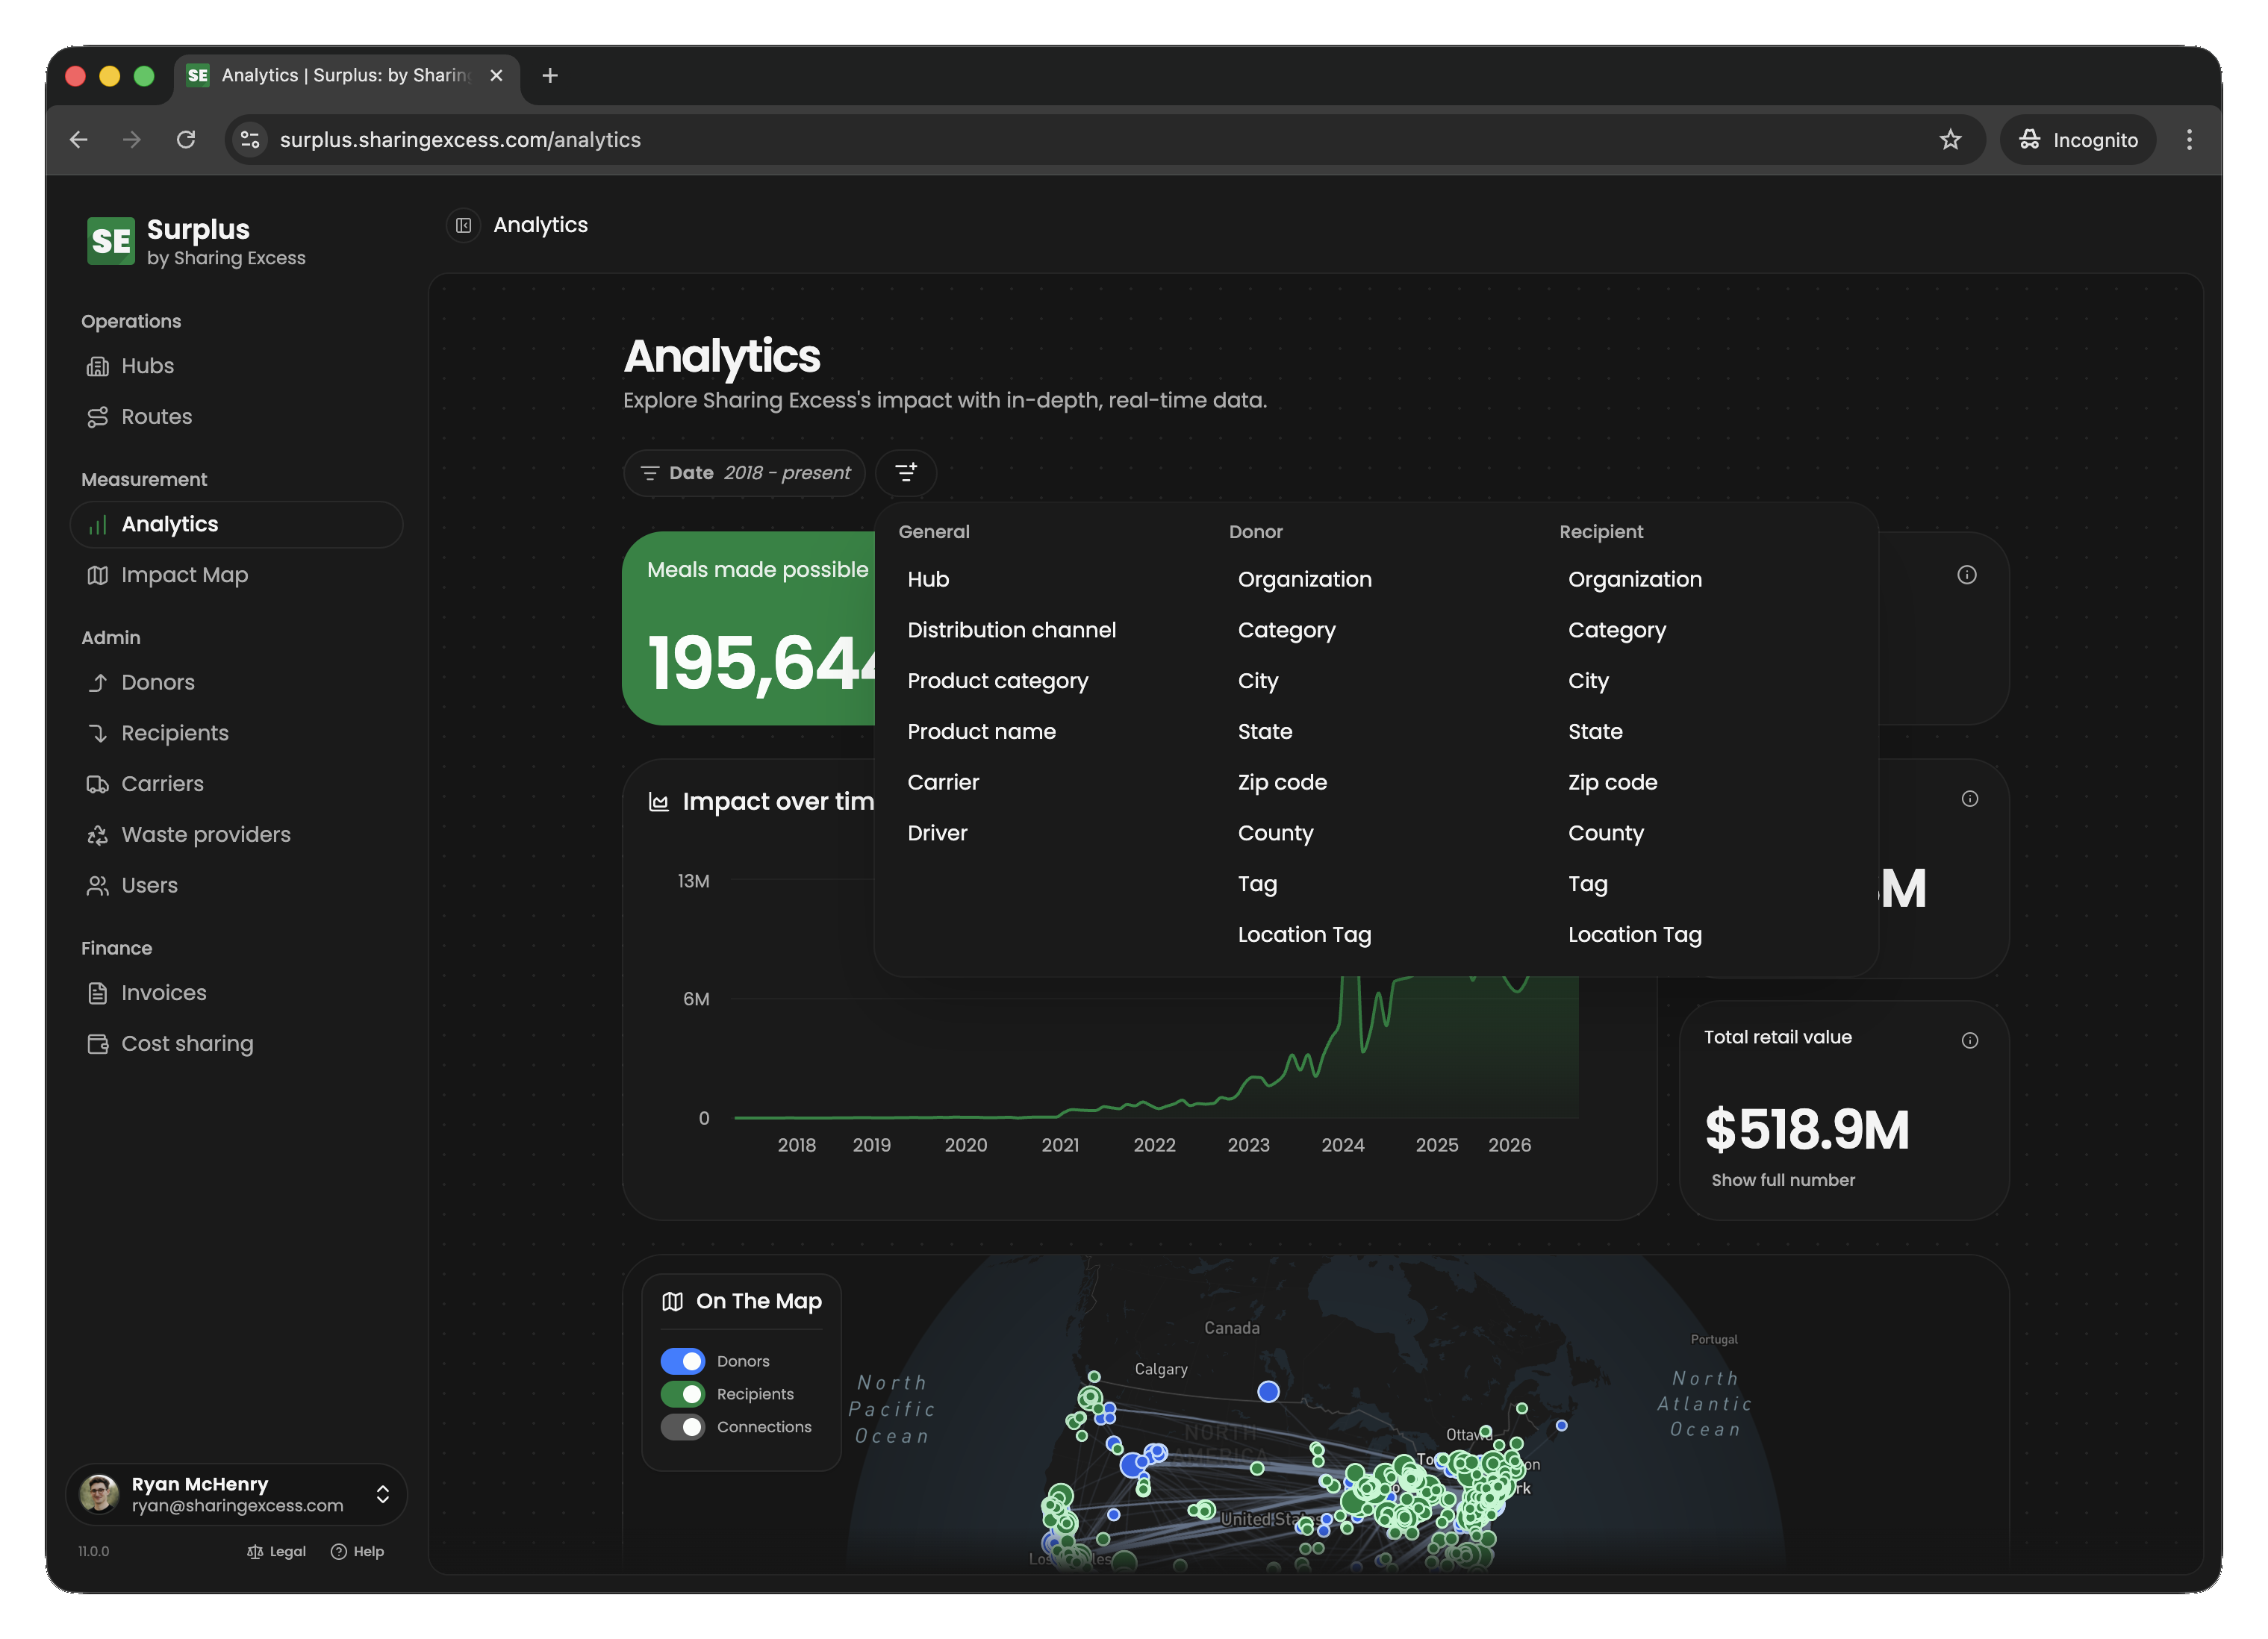
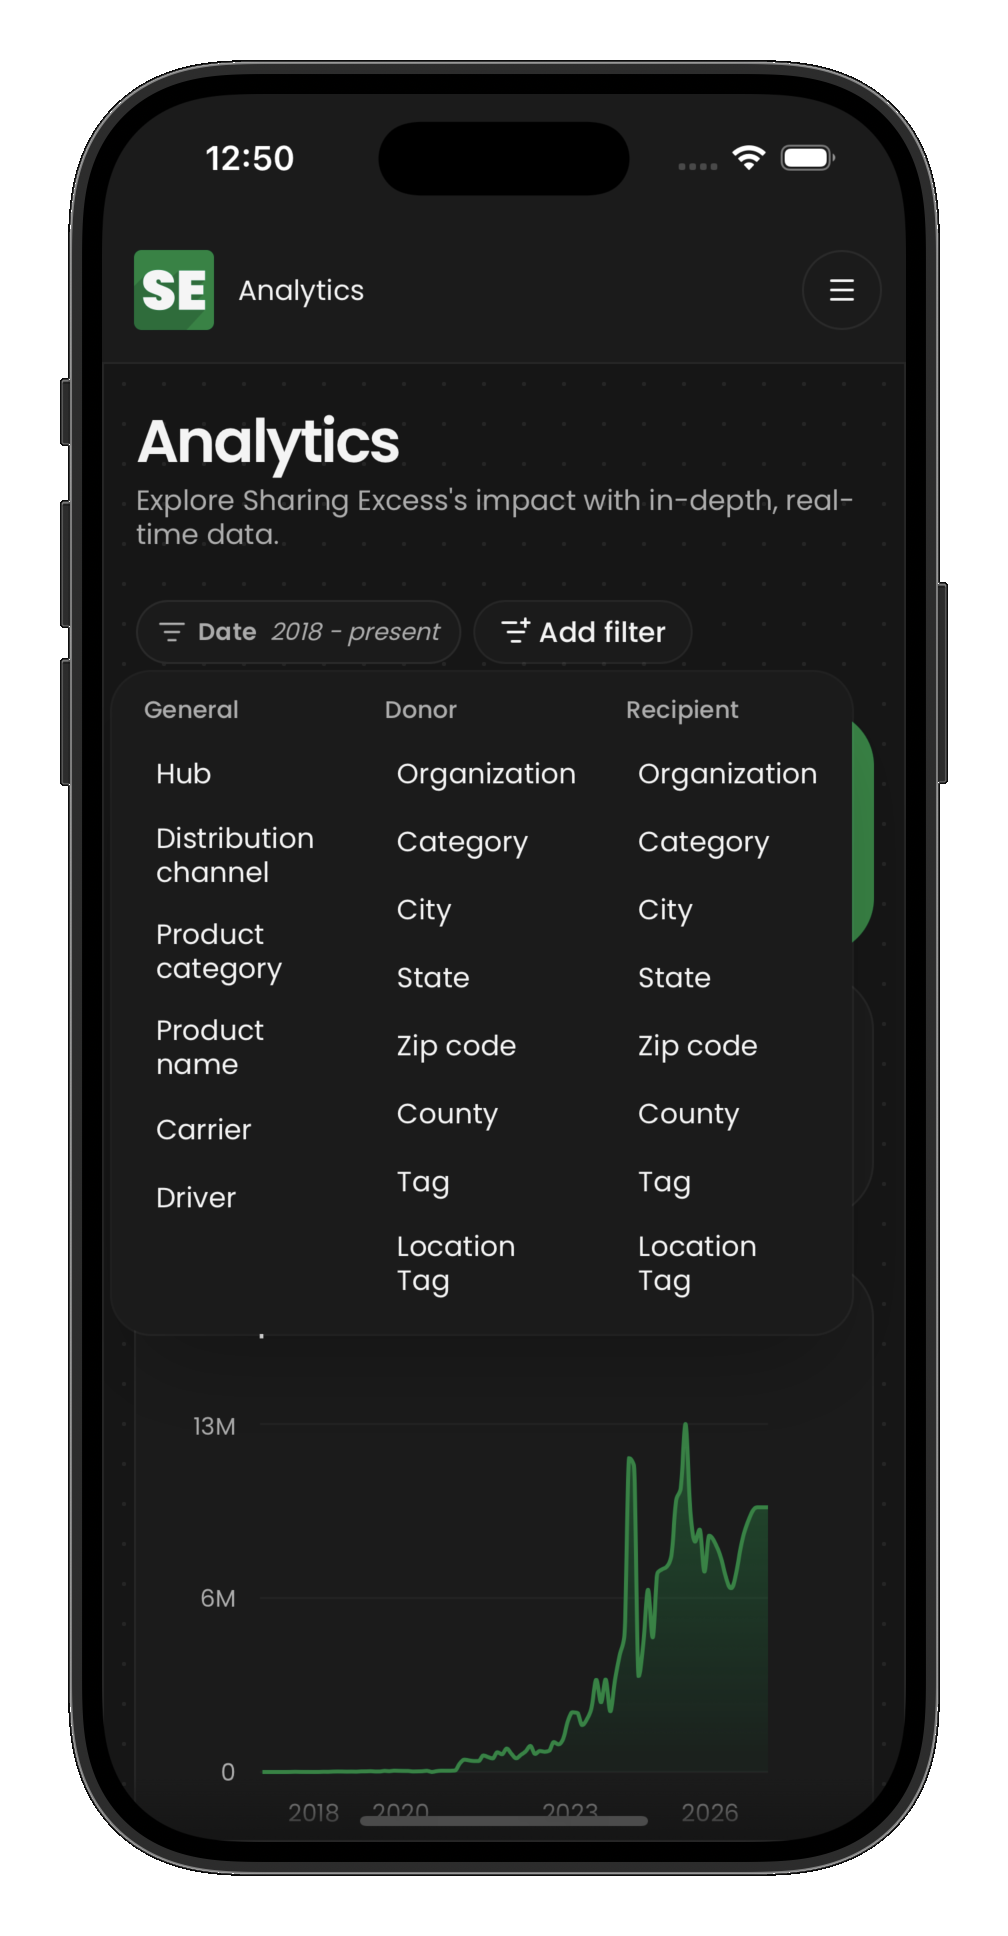
Available filters include:
- Date range — see impact for a specific time period
- Donor — filter to a single donor or group of donors
- Recipient — filter to a specific recipient
- Hub — see impact flowing through a particular warehouse
- Product category — break down by food type
Filters combine with AND logic — selecting a donor and a date range shows only that donor's contributions in that time period.
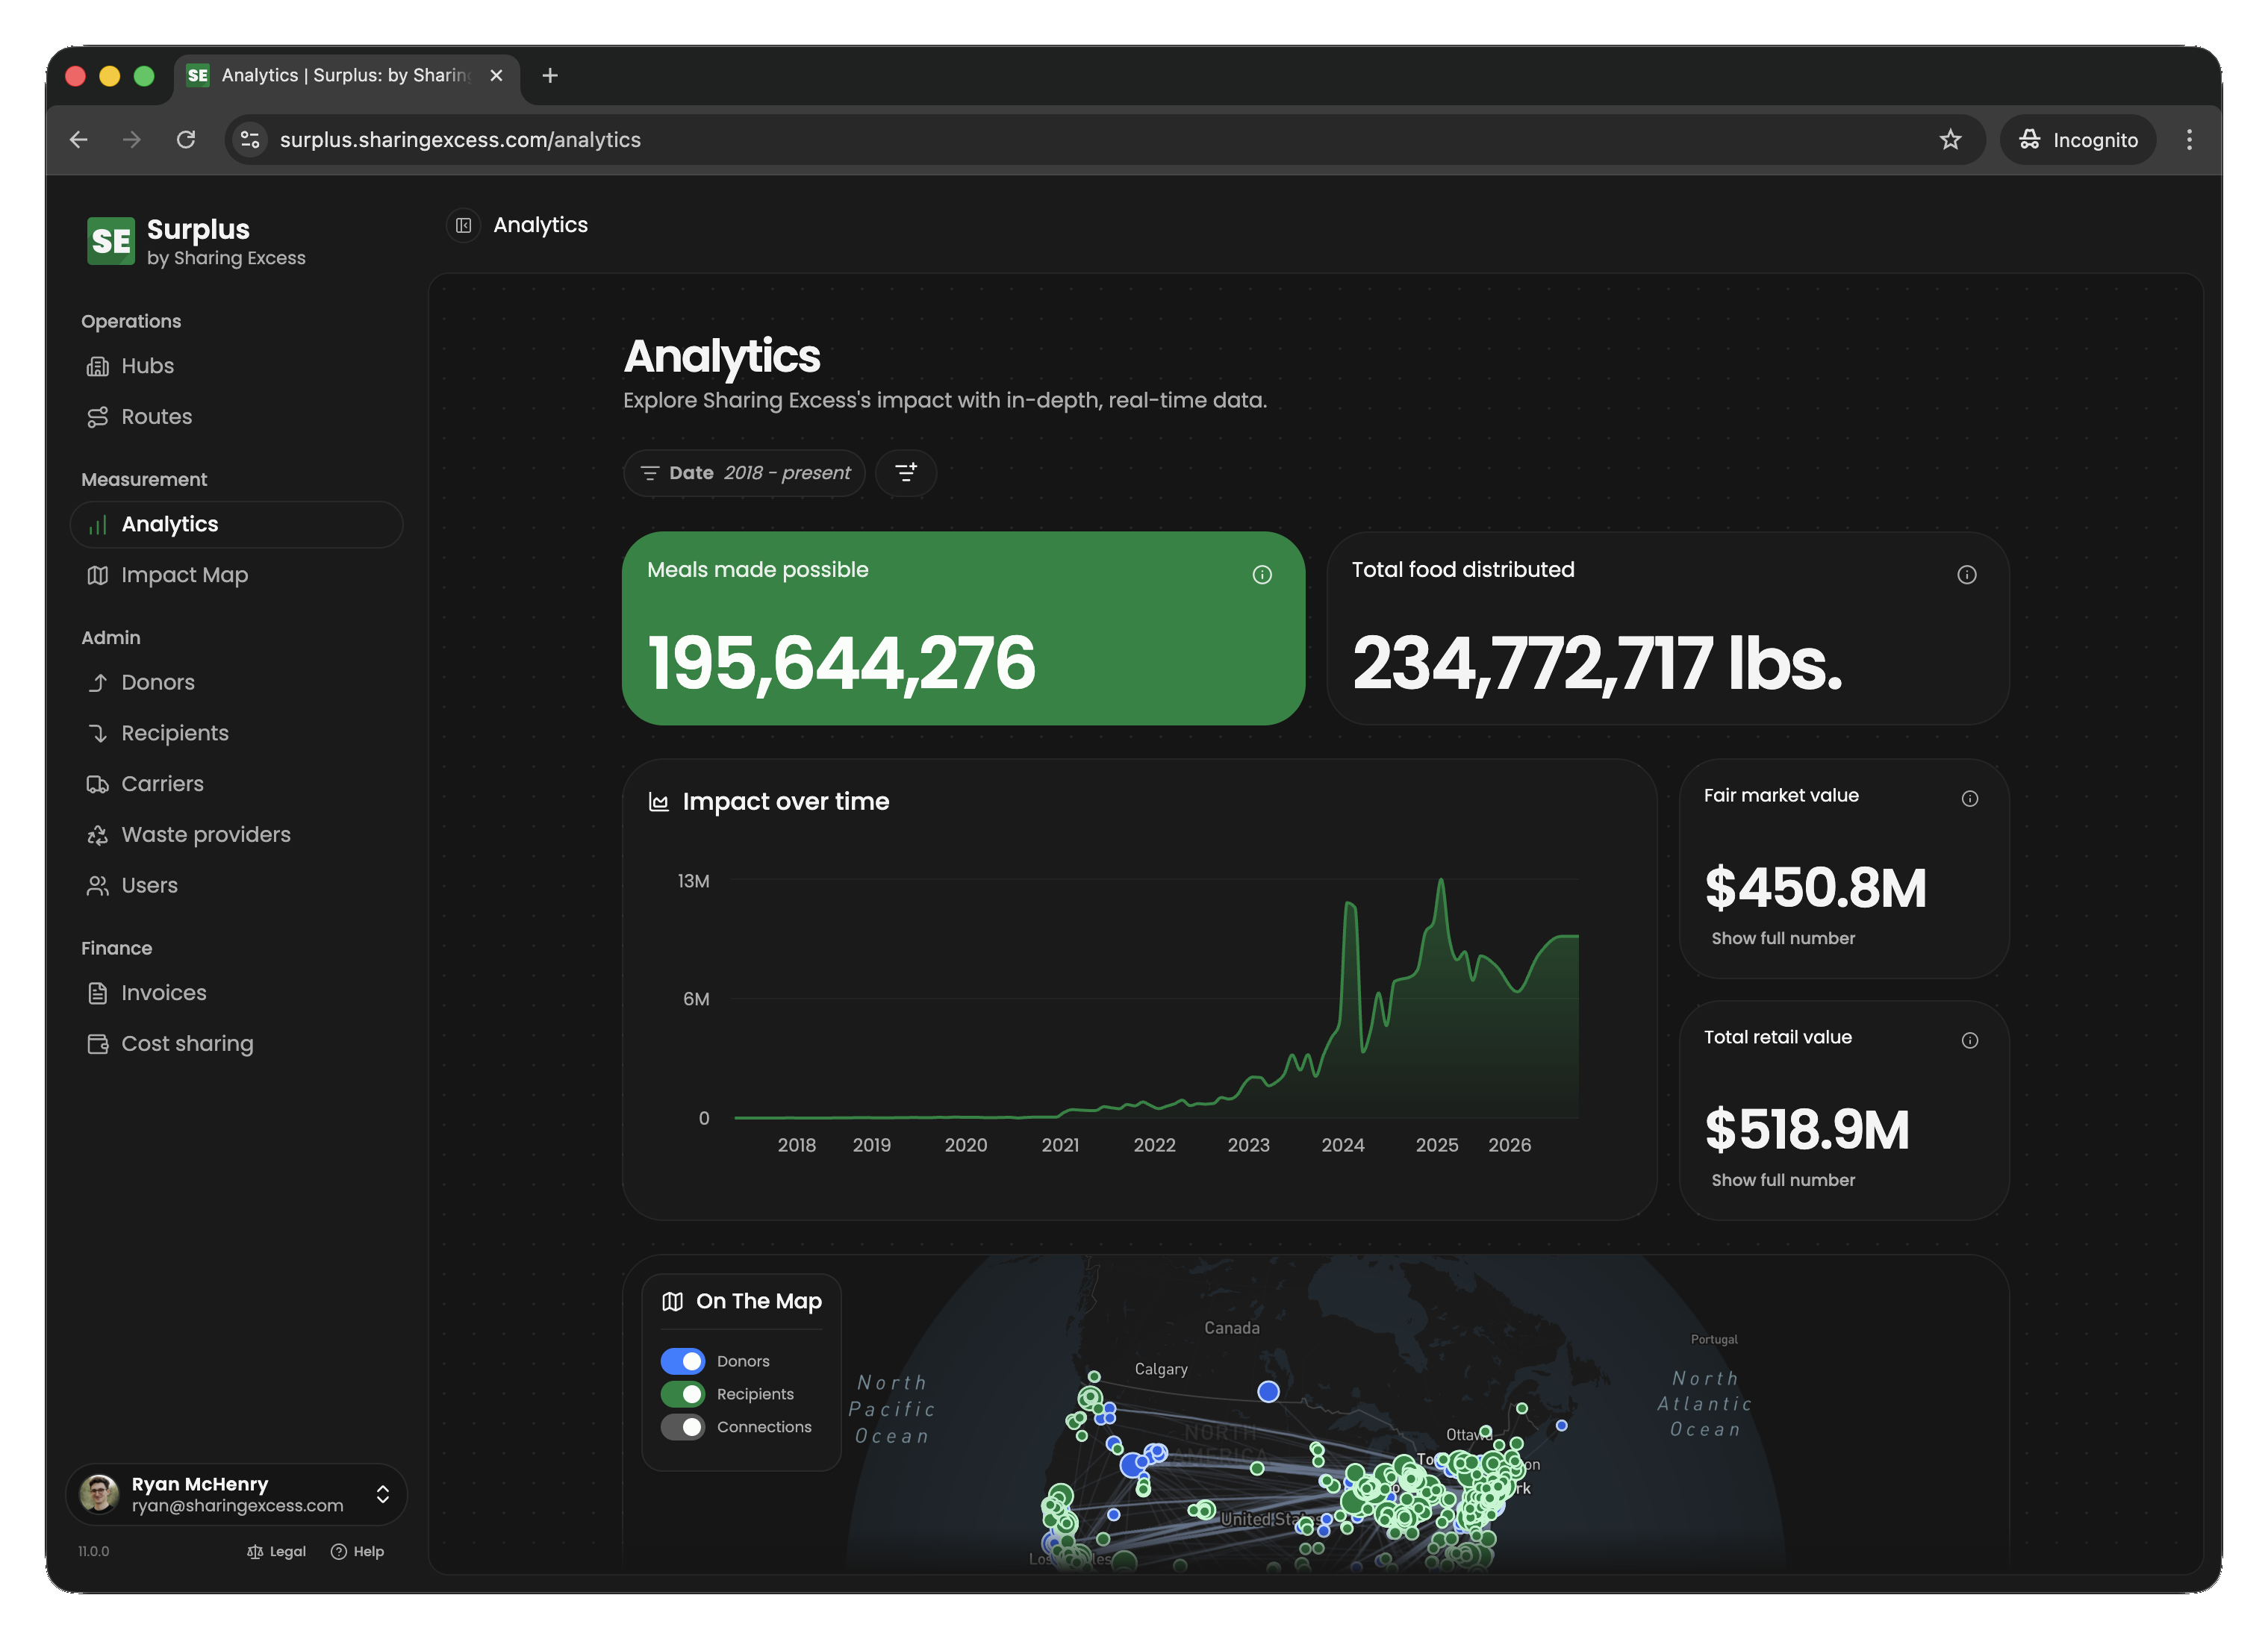
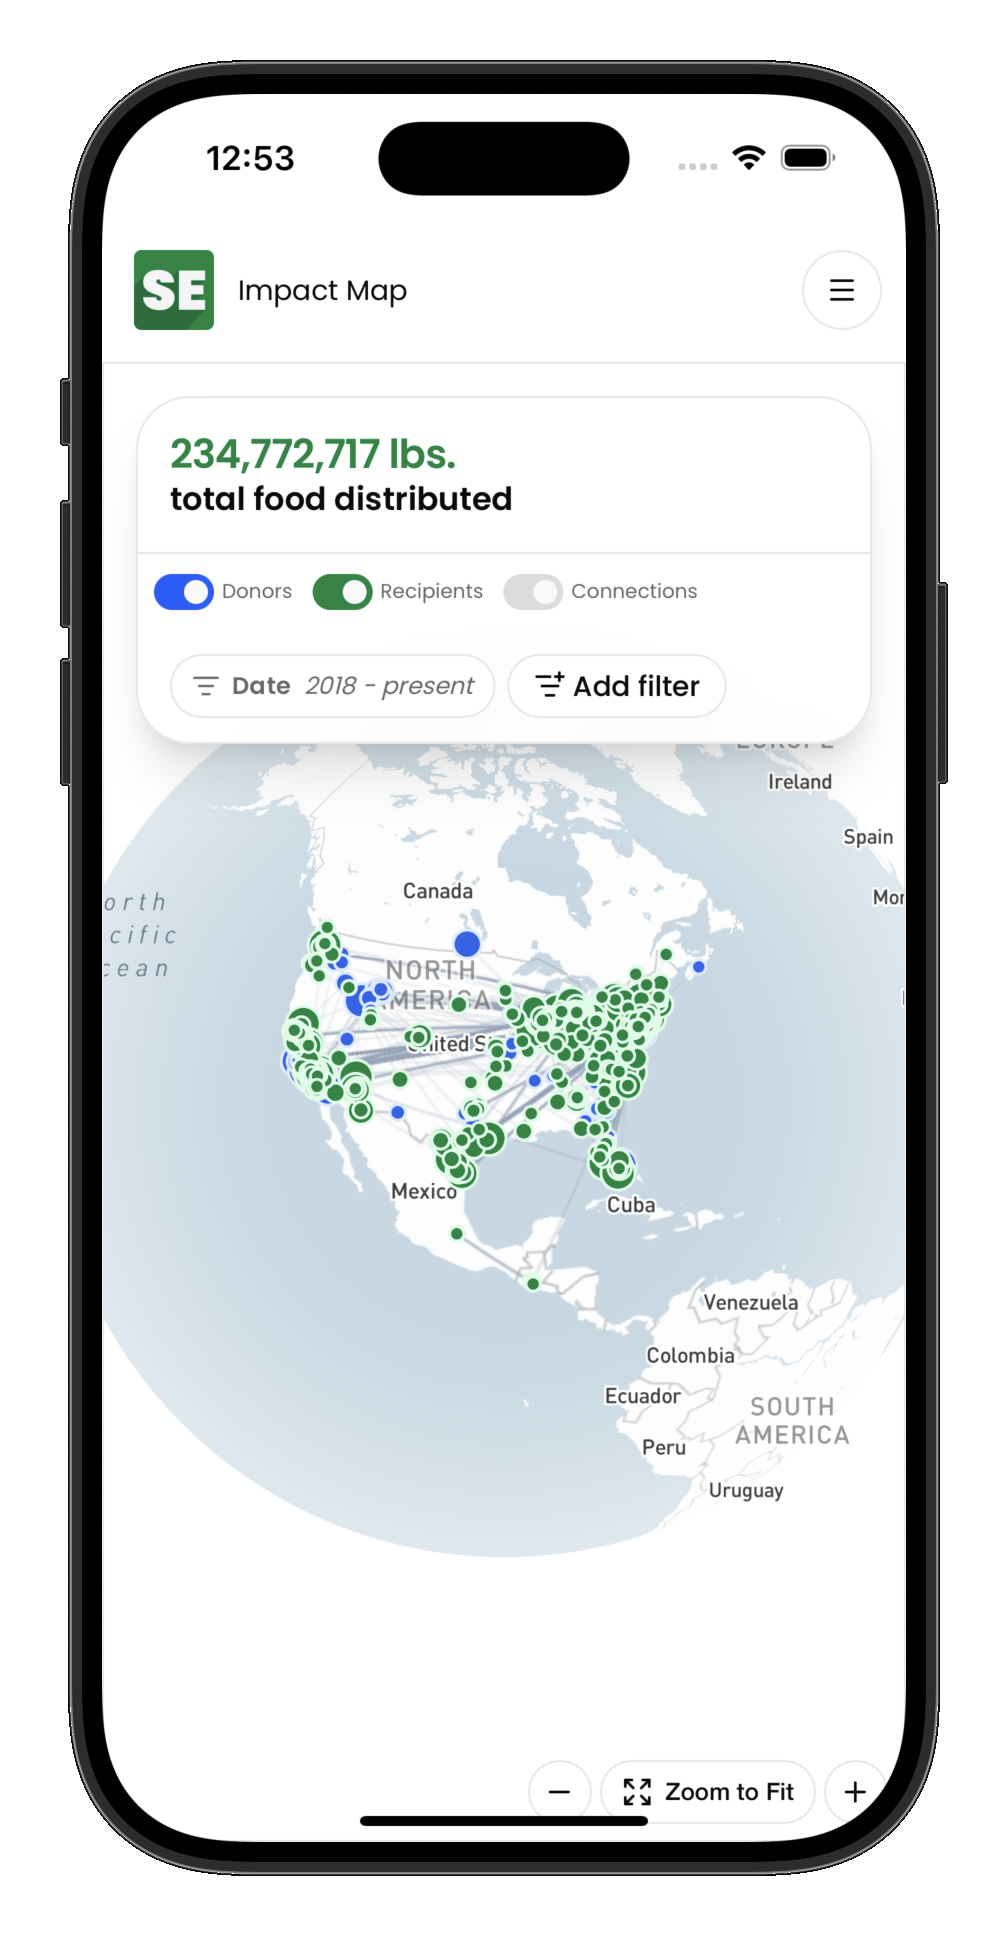
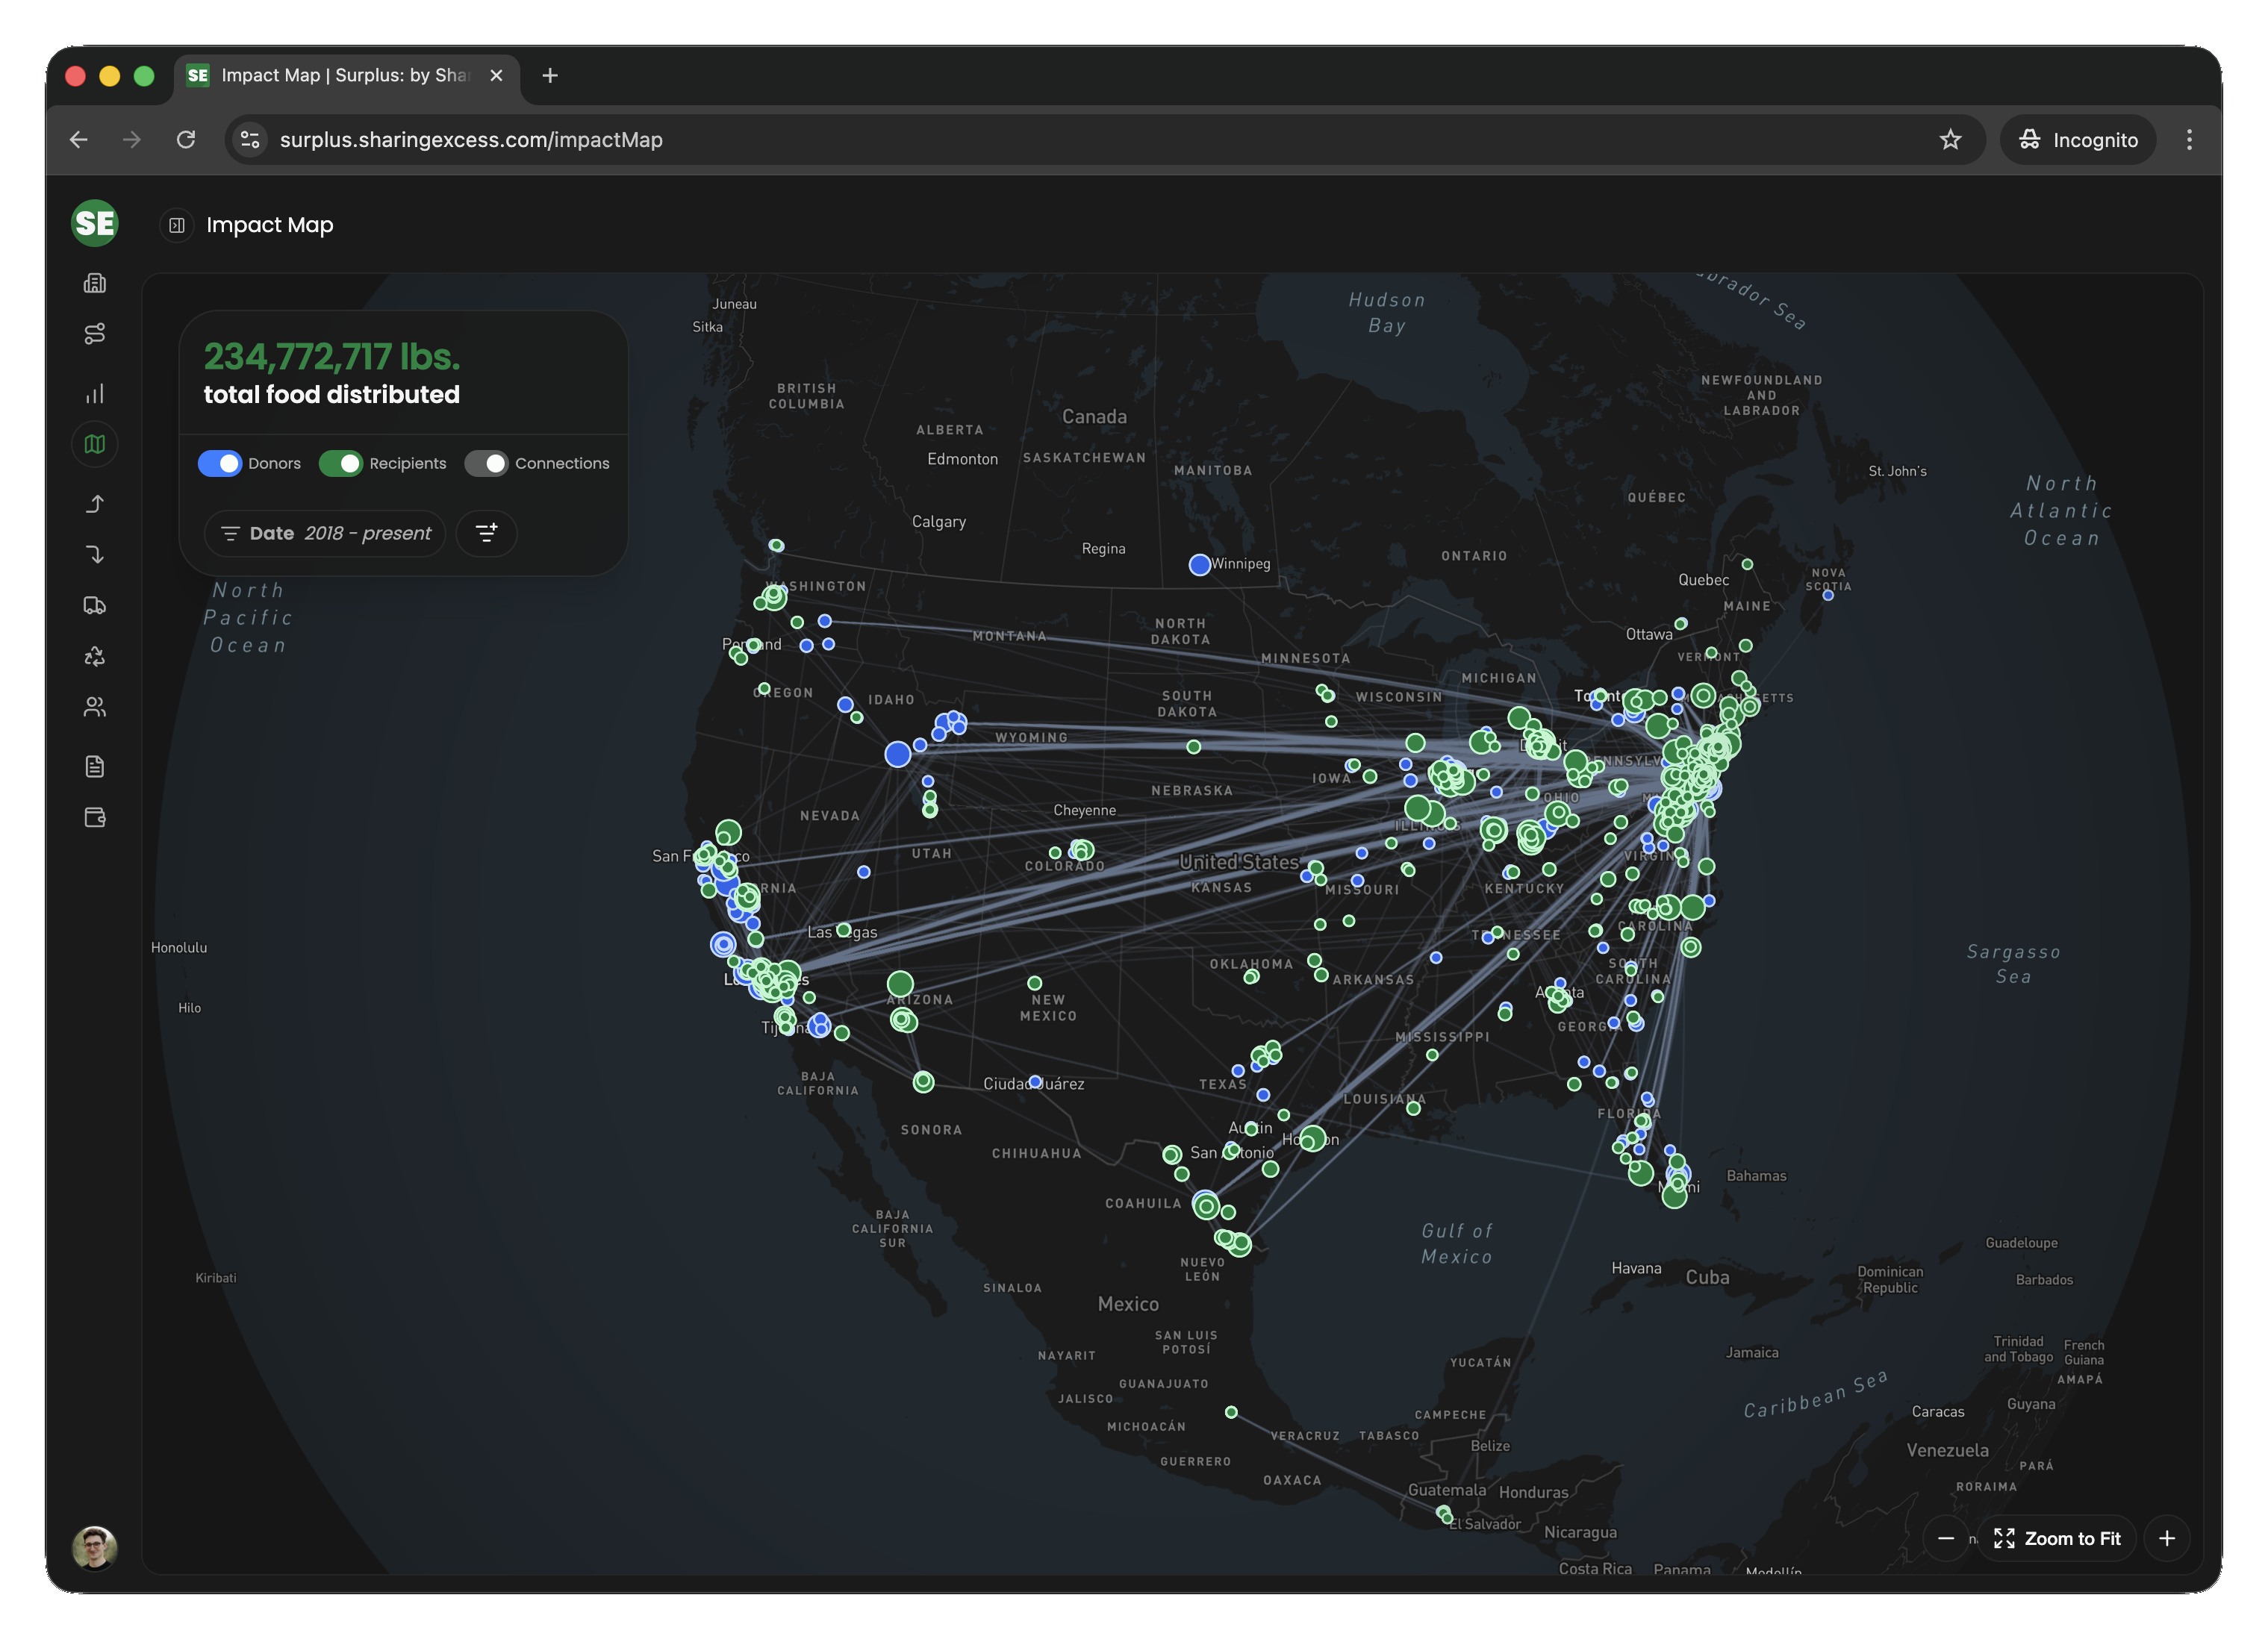
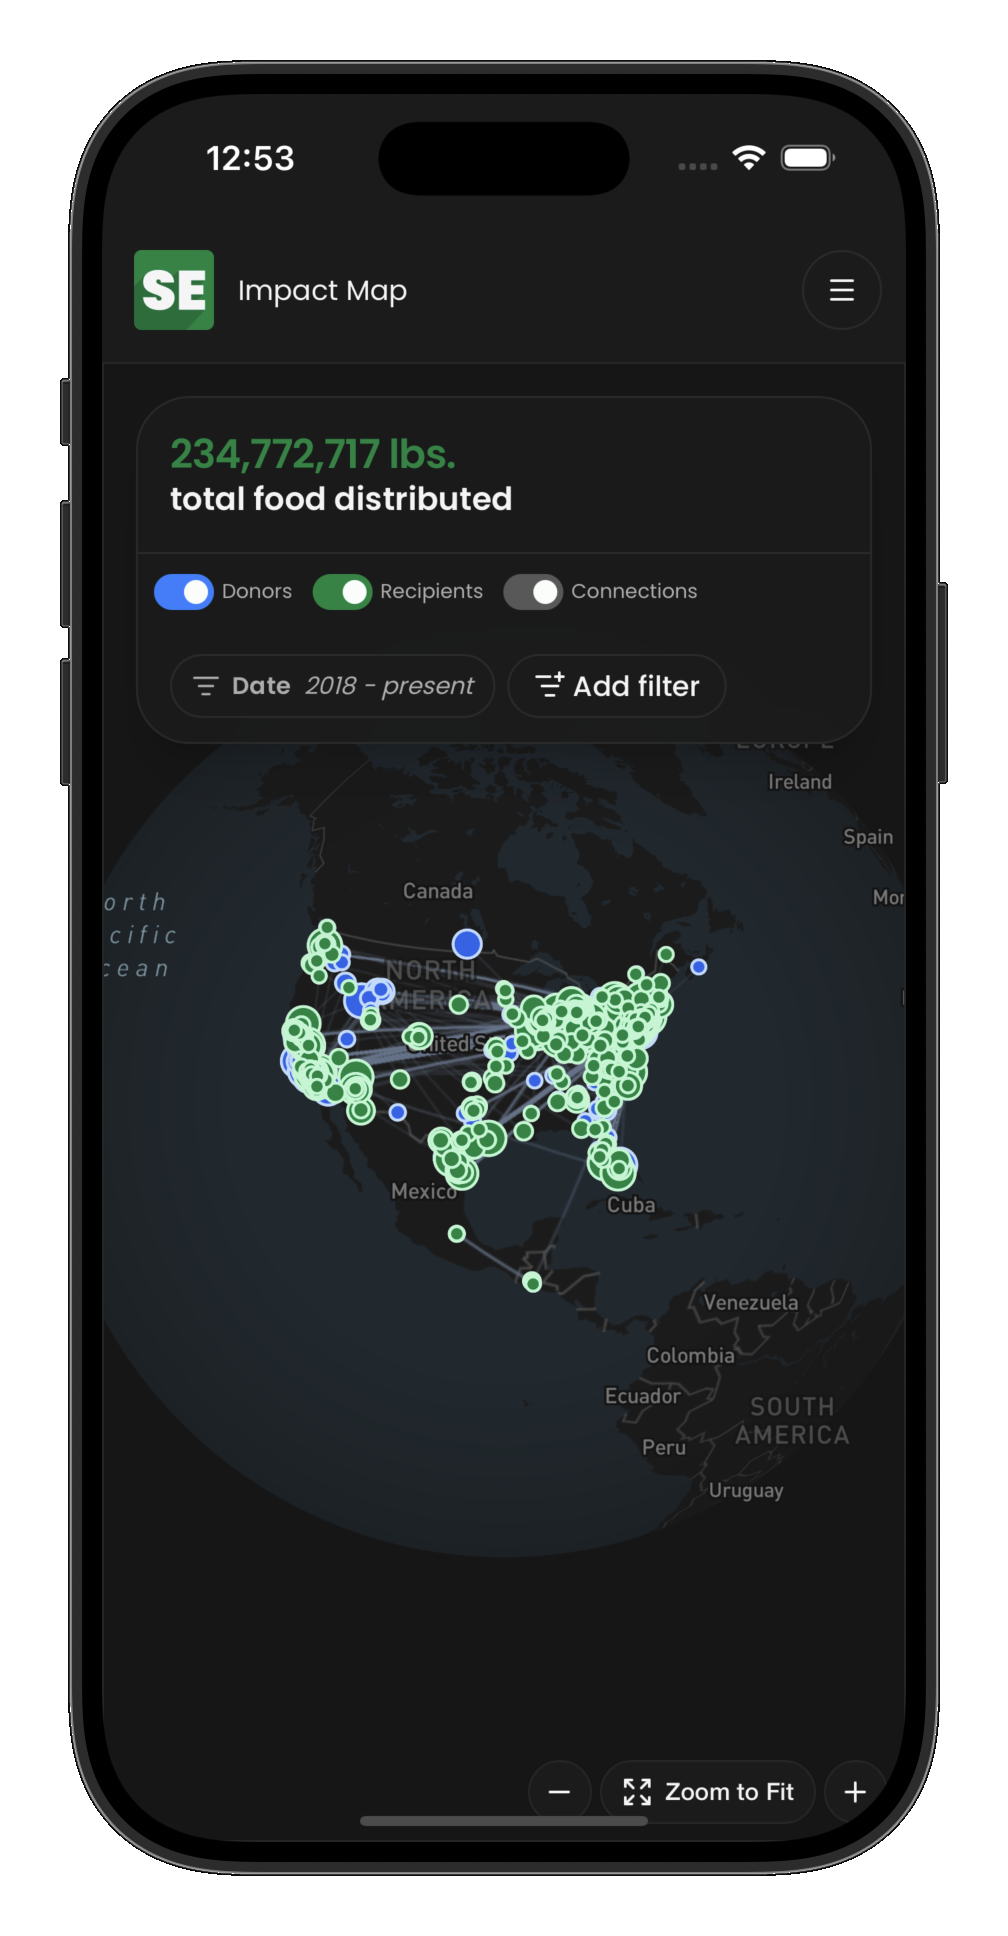
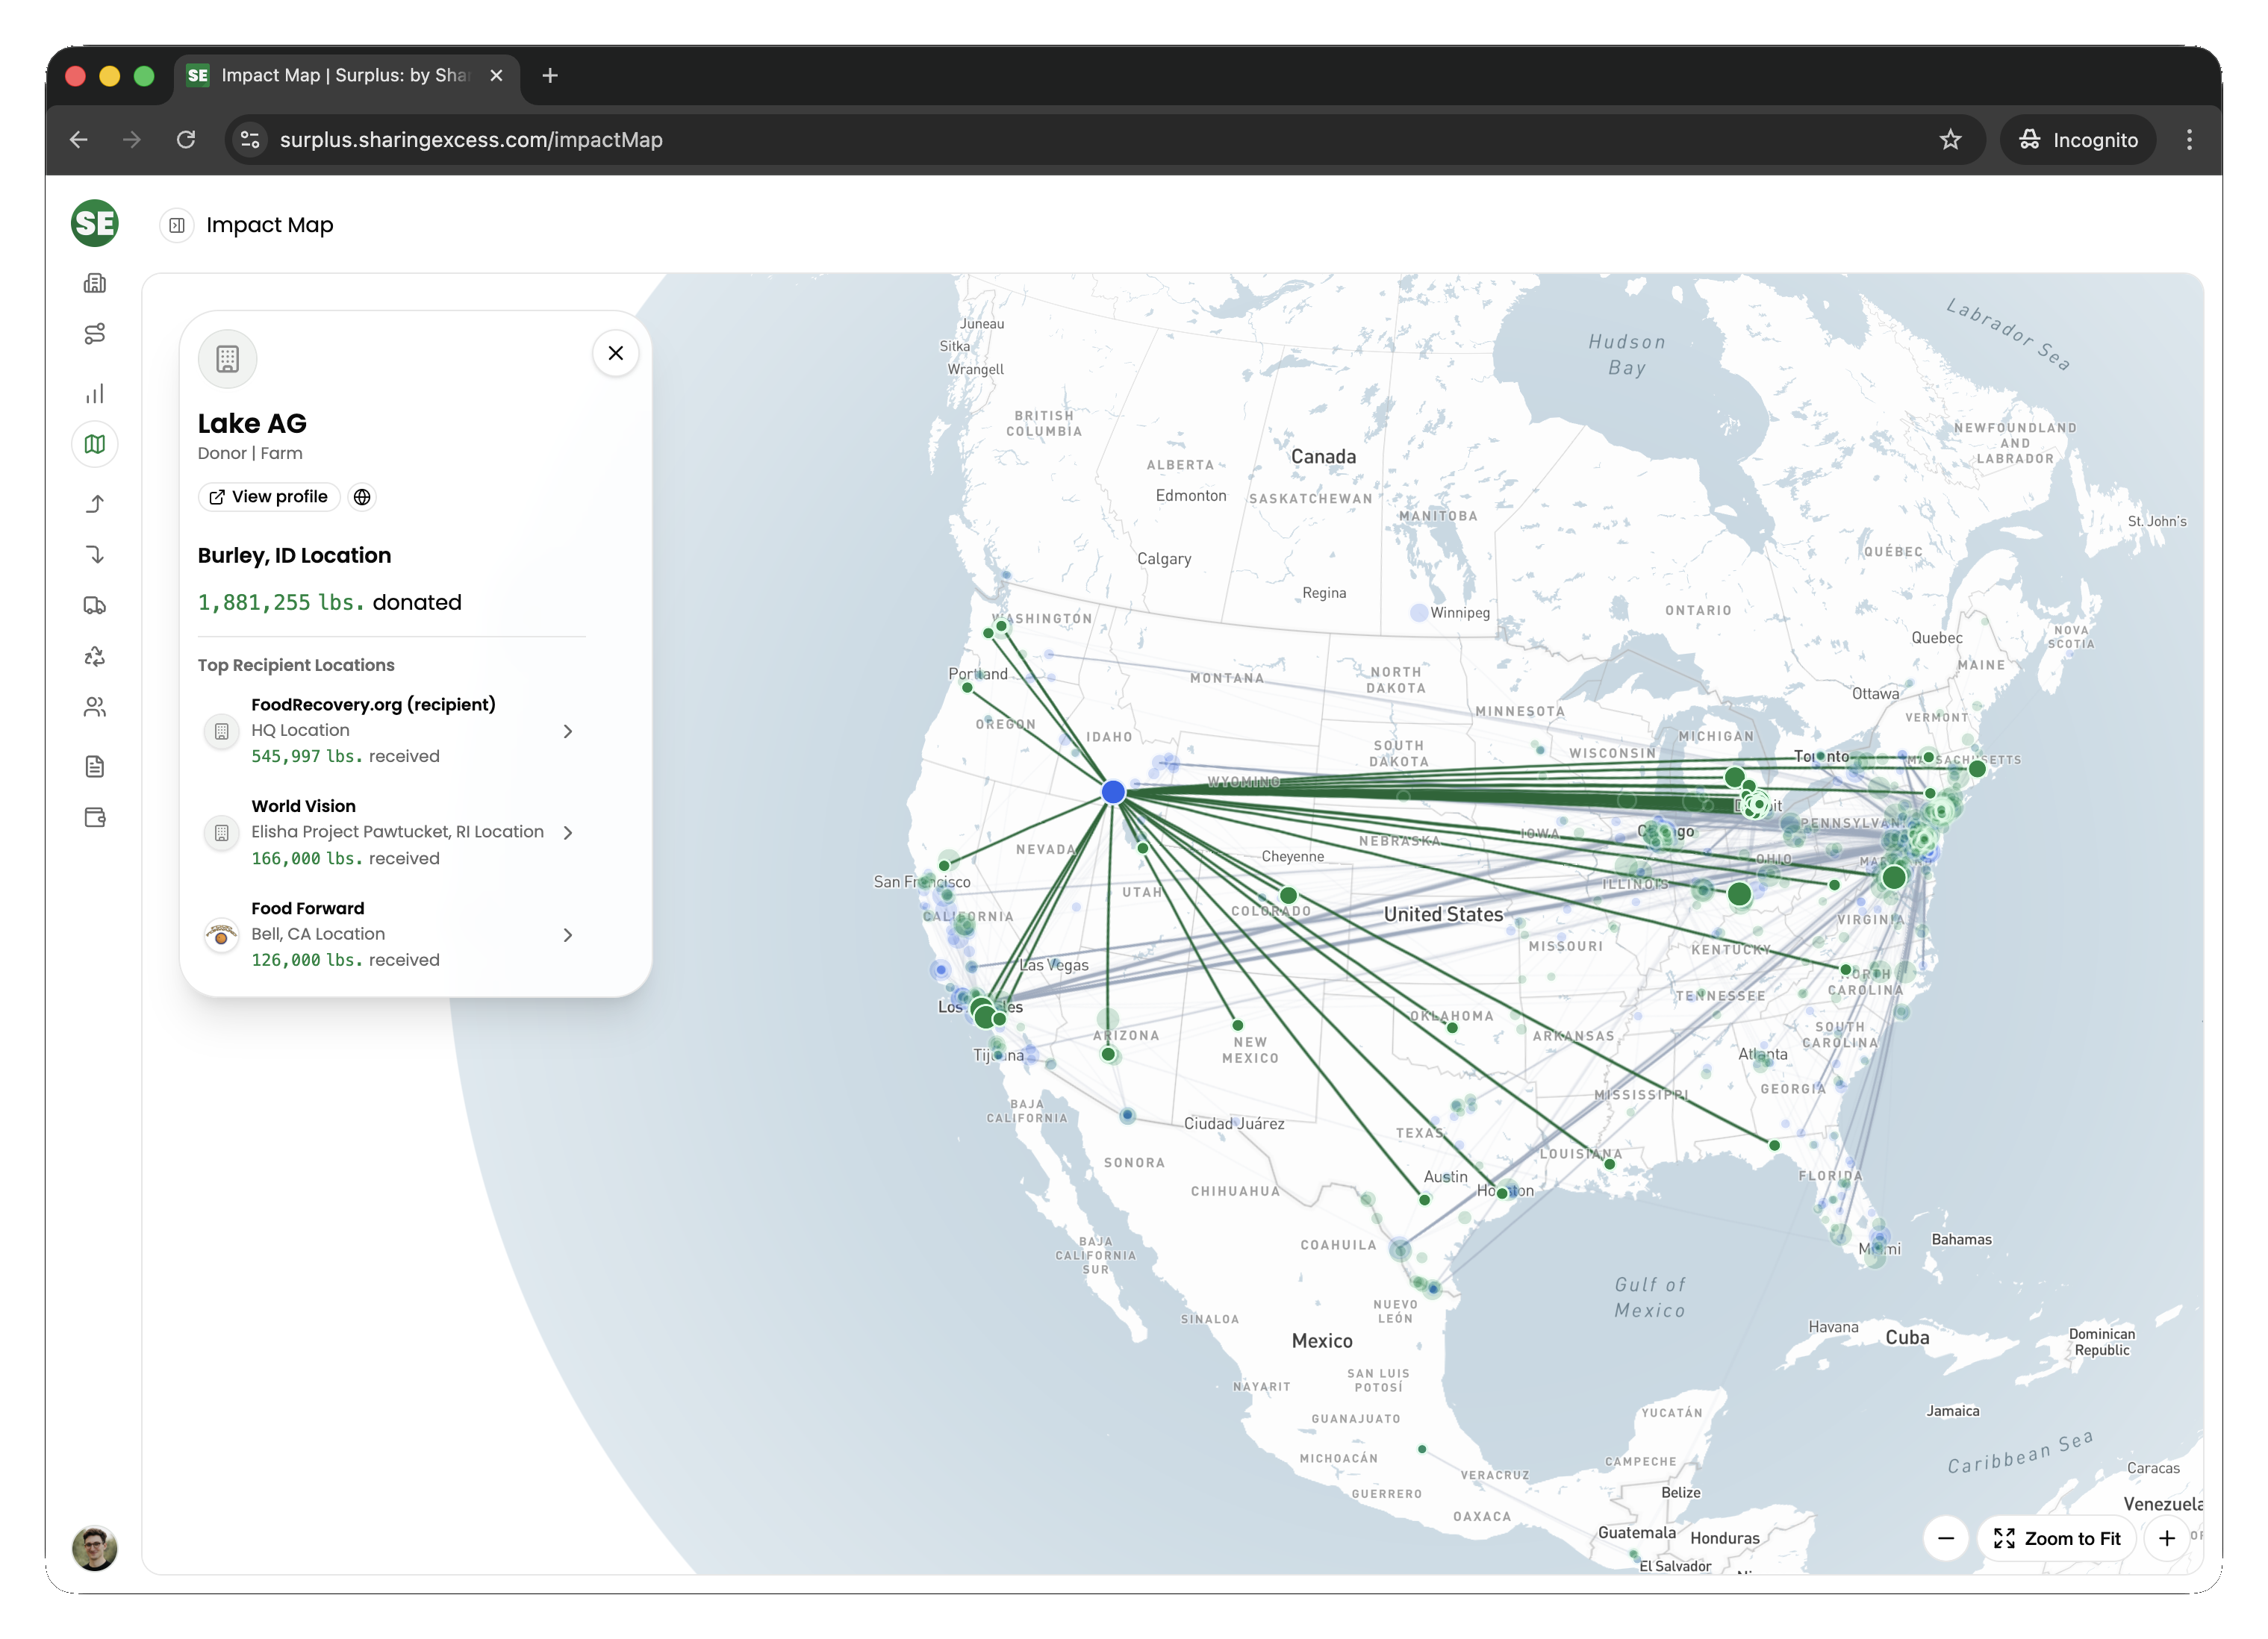
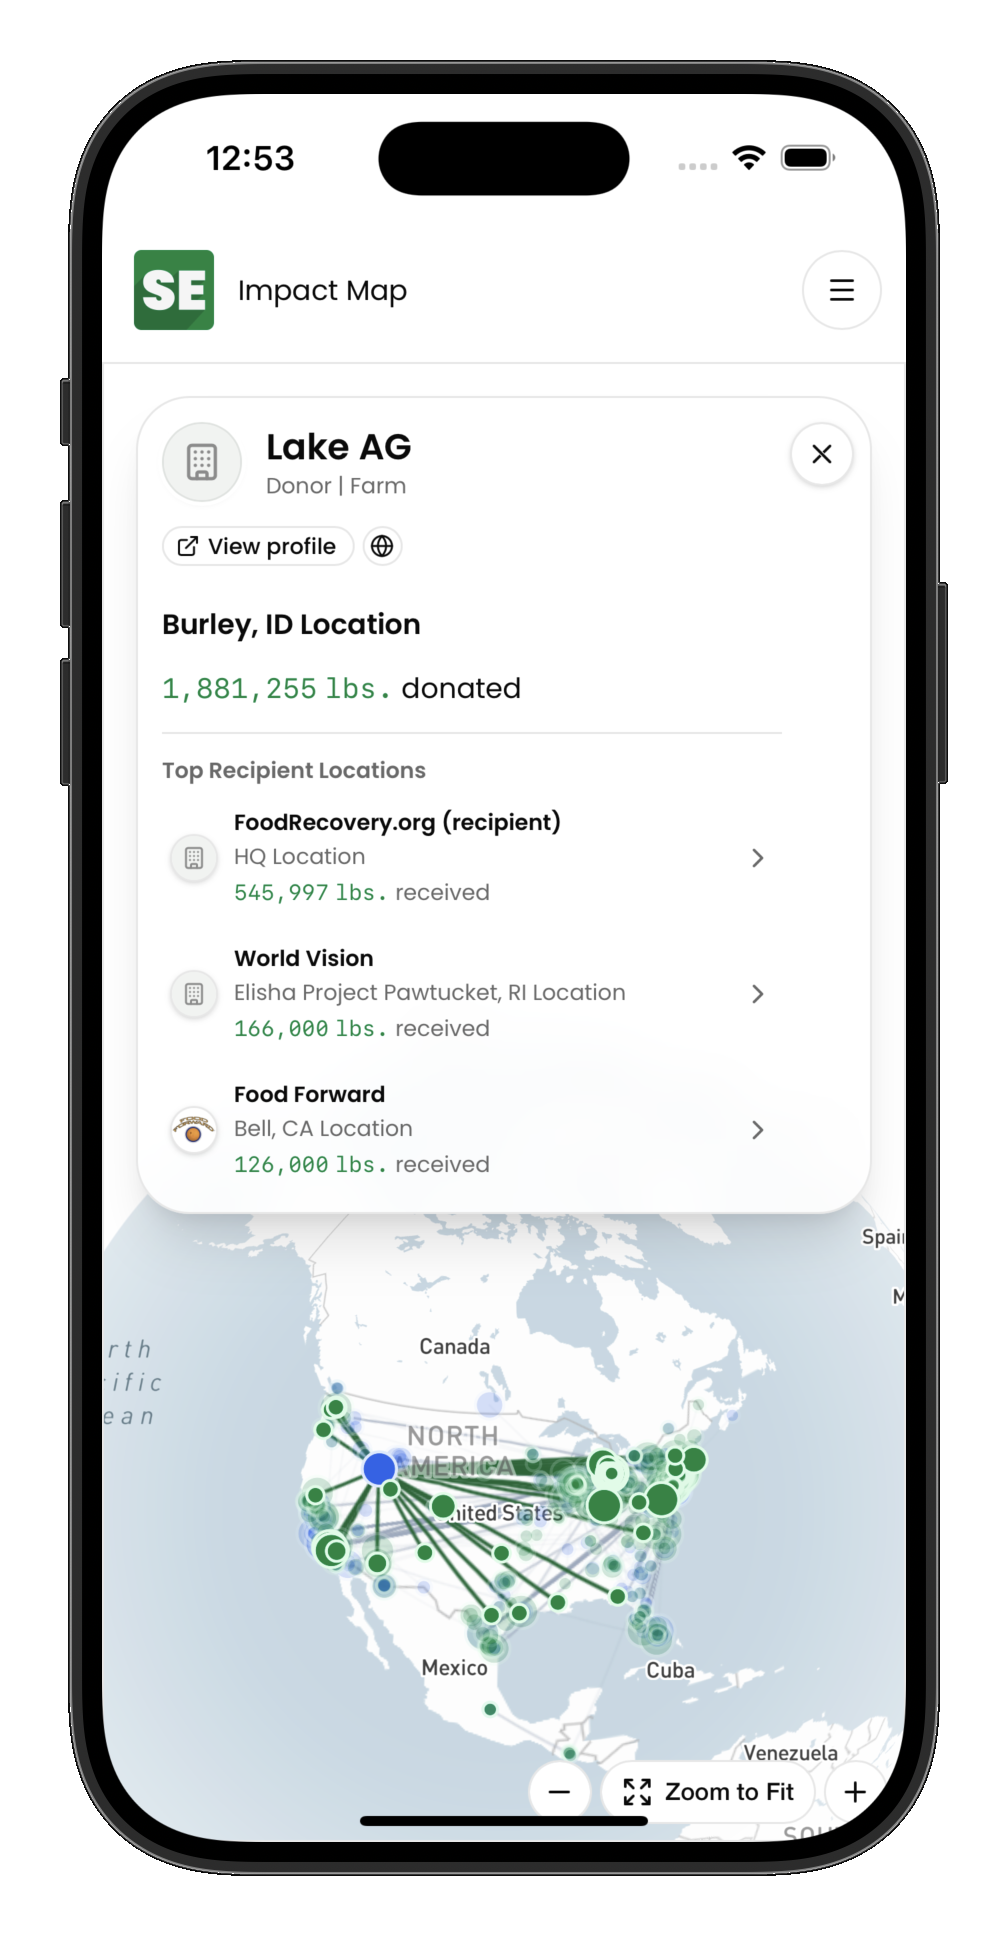
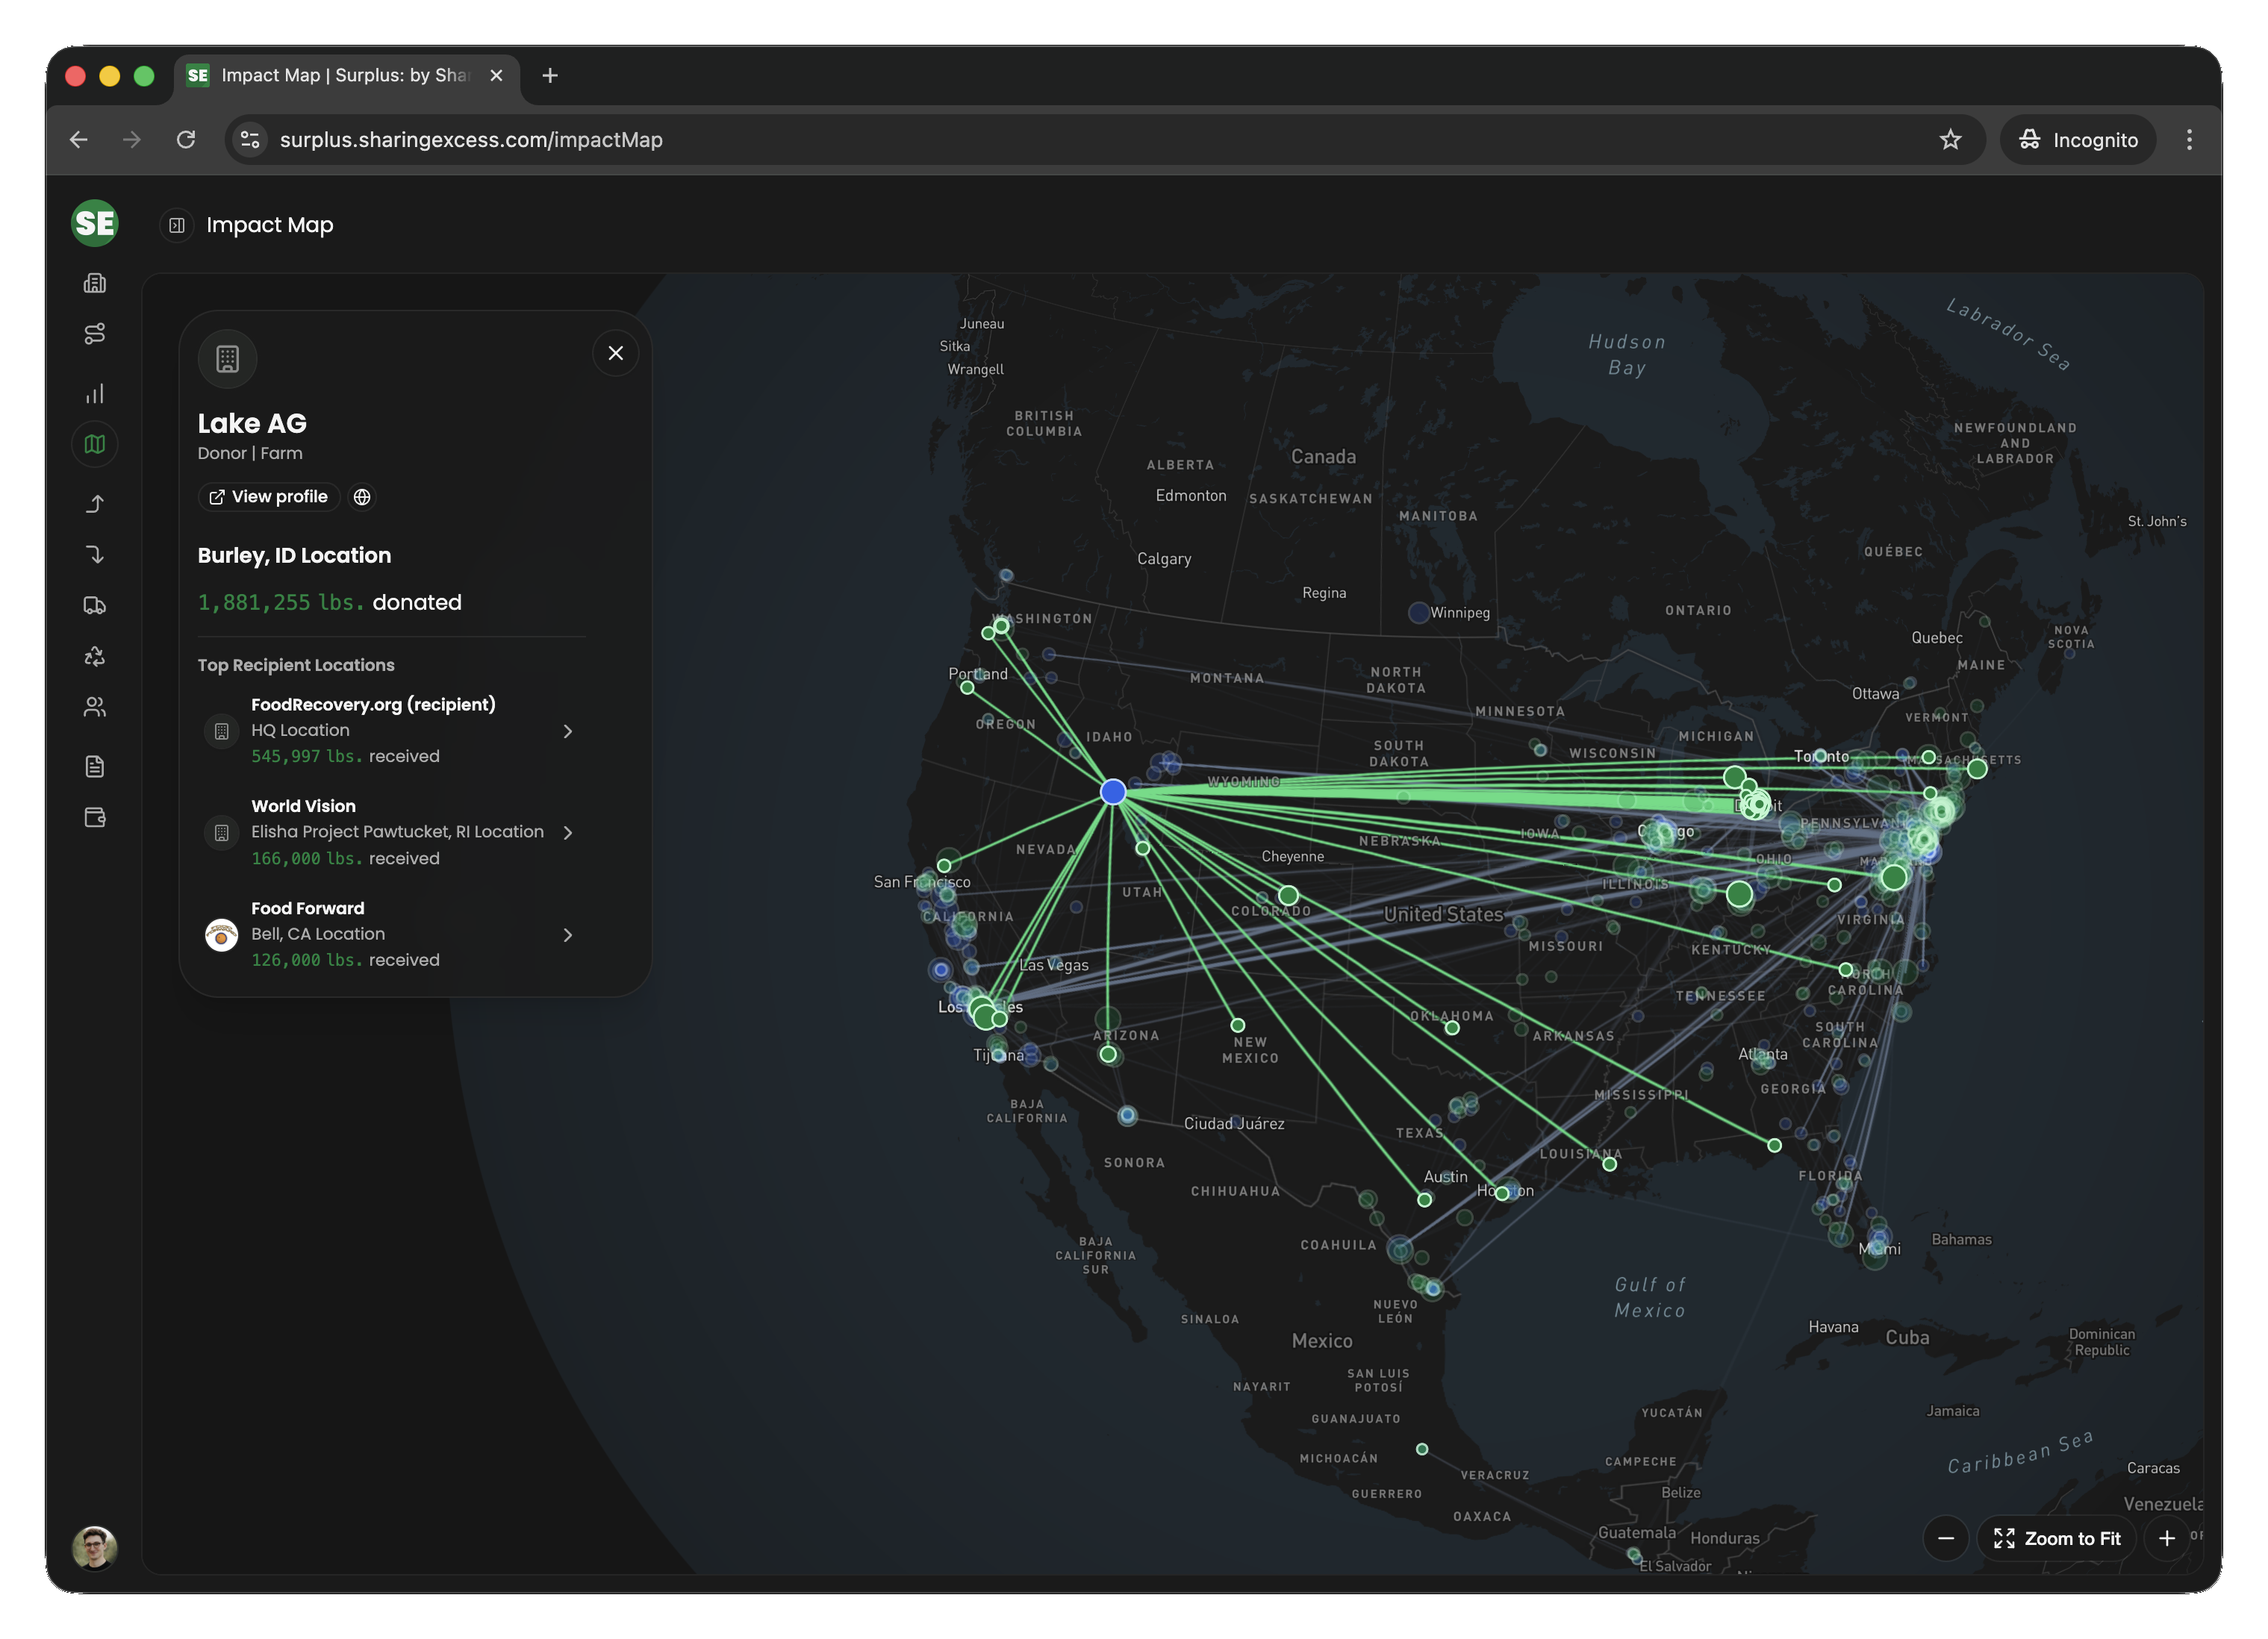
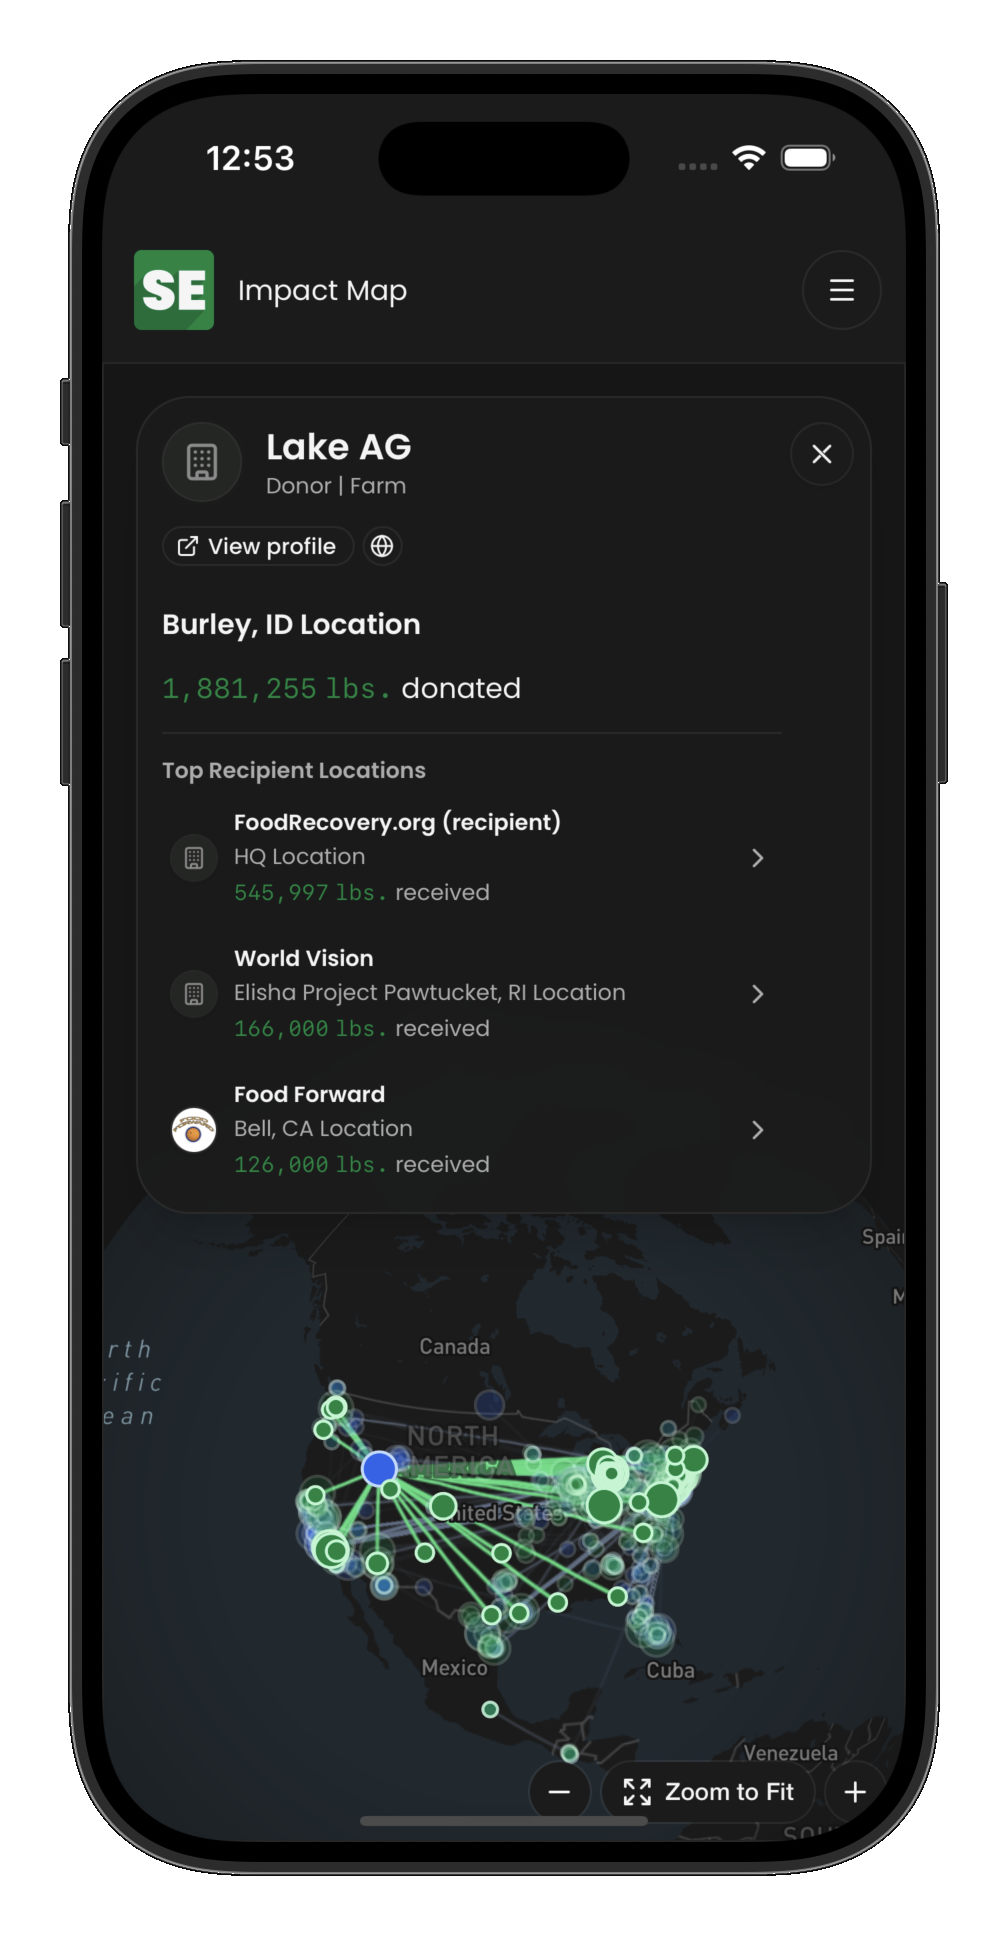
The impact map
The impact map provides a geographic visualization of the food rescue network — showing donor and recipient locations, routes, and flow patterns.
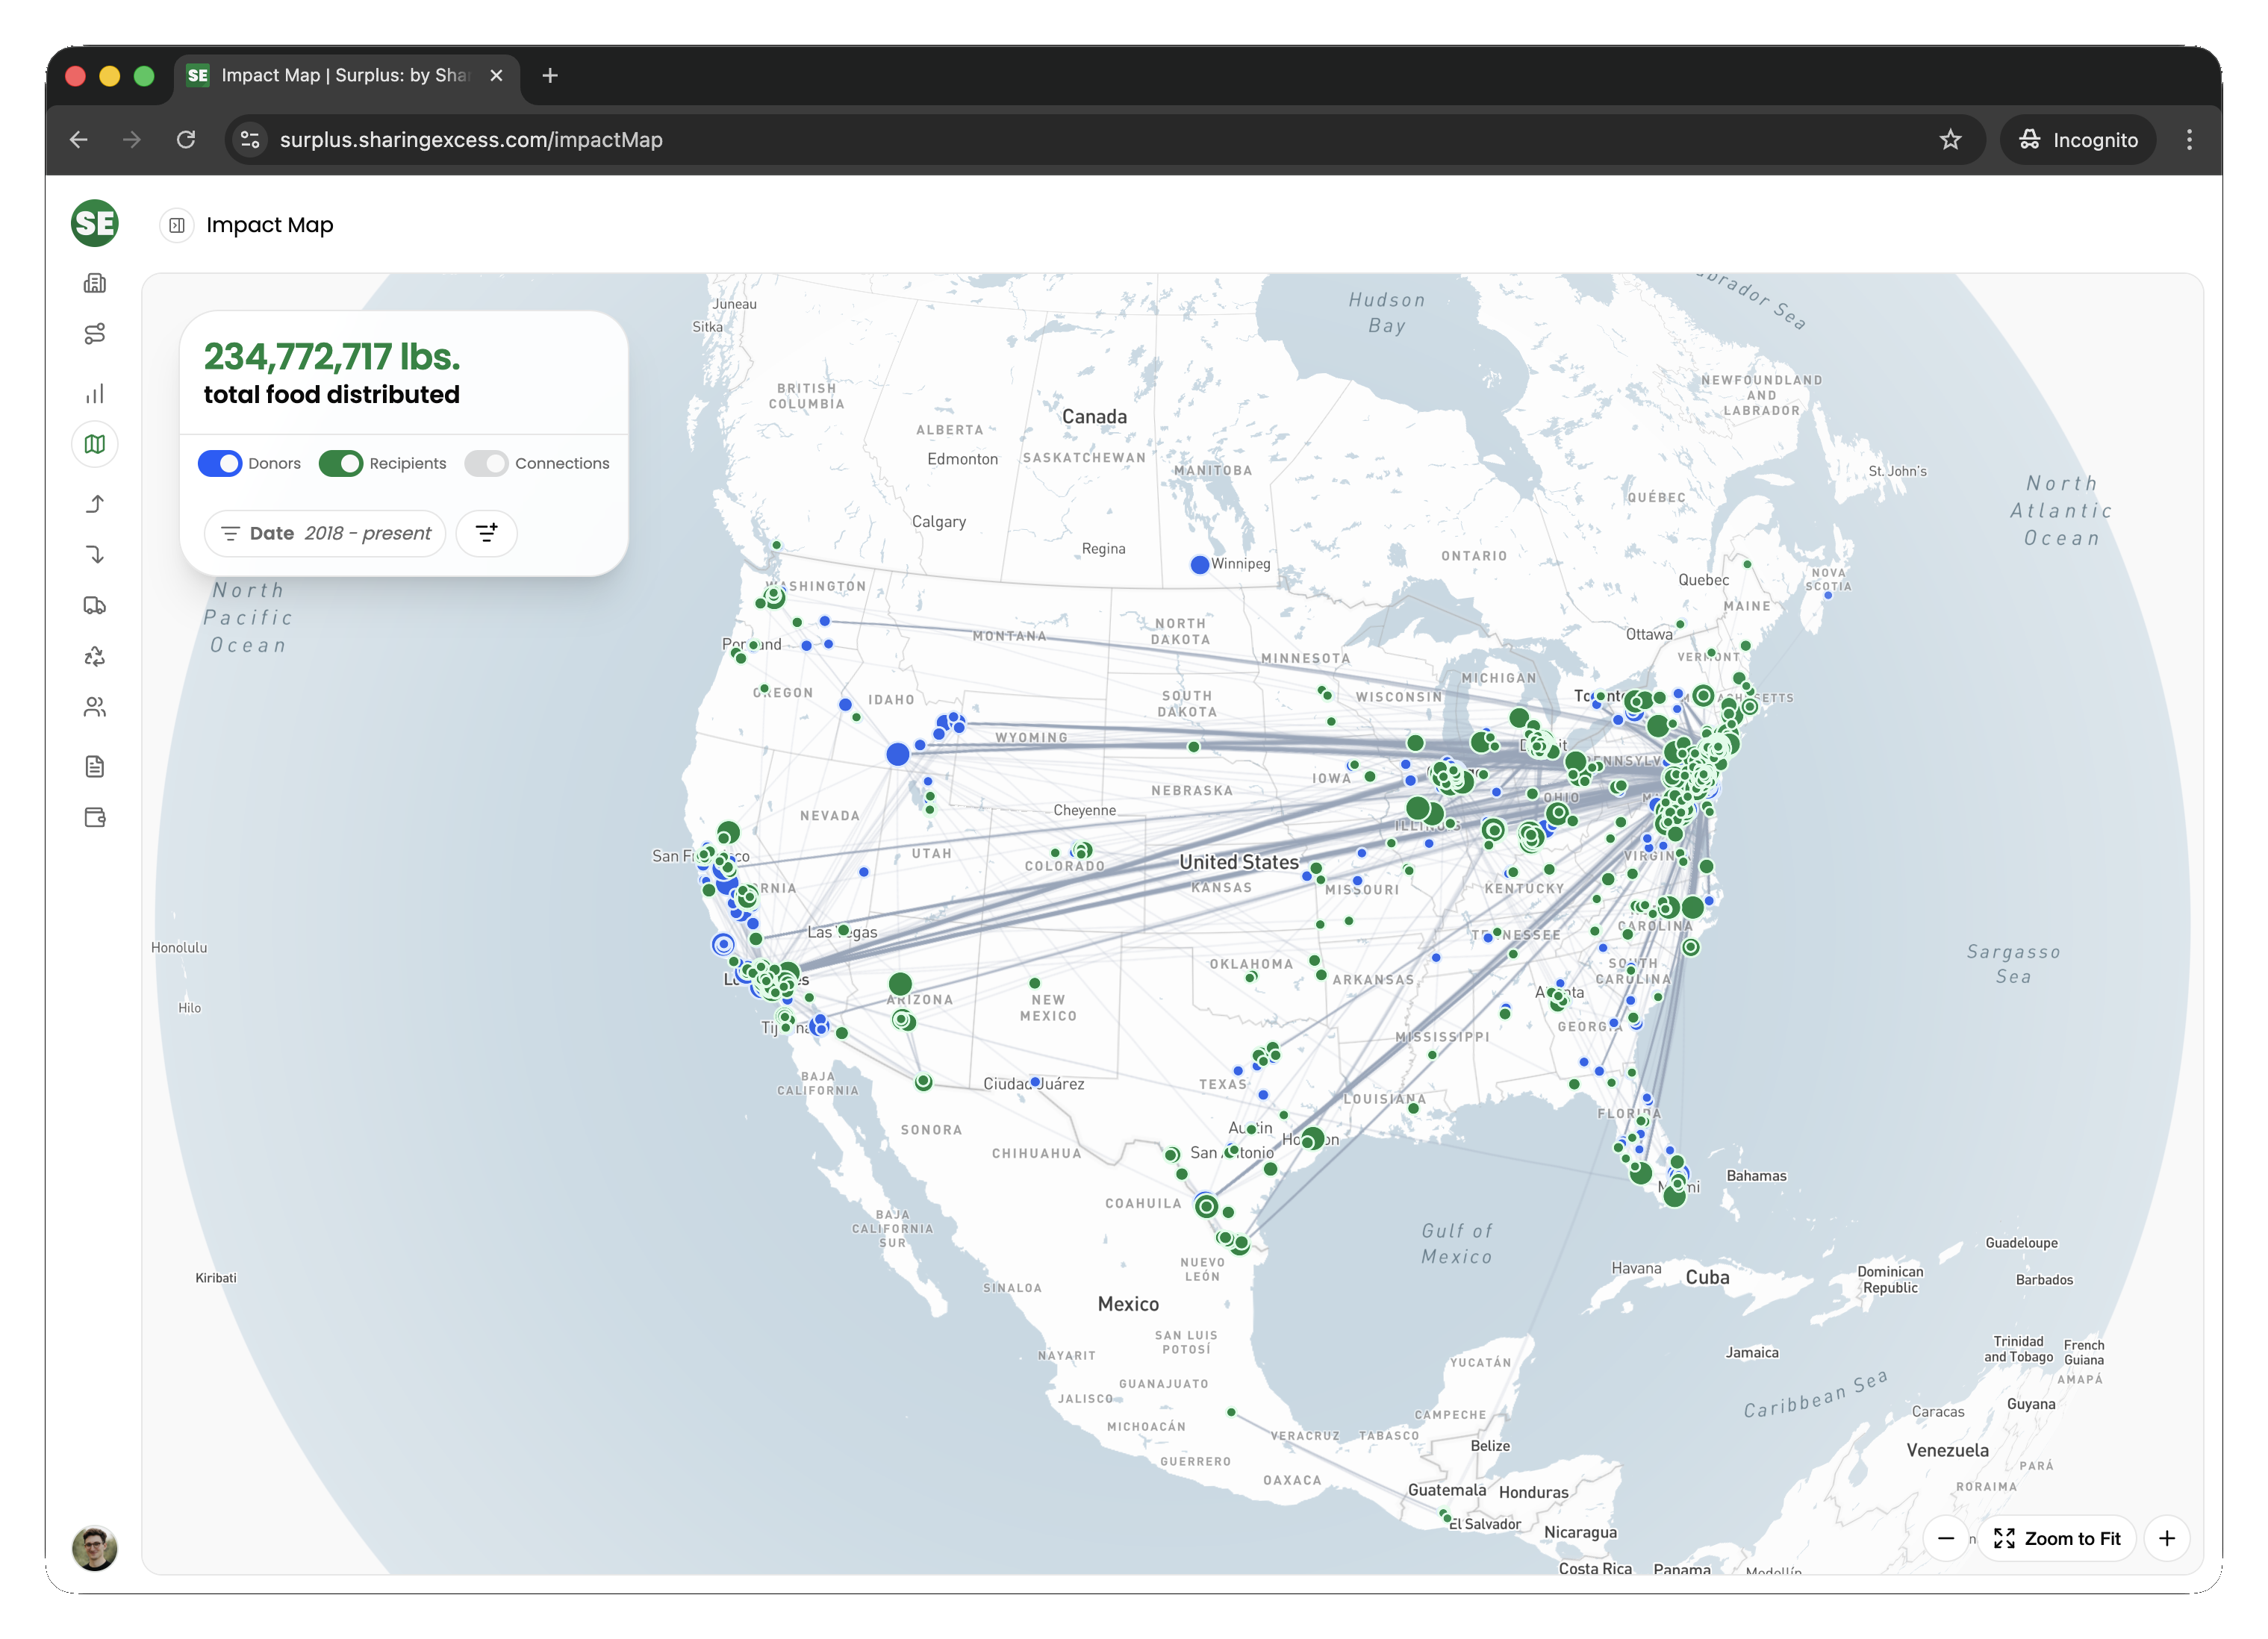
Tap a location on the map to see its details:
Understanding the numbers
All analytics metrics are derived from completed distributions only. Food that was collected but not yet distributed does not appear in impact numbers. This ensures reported impact reflects food that actually reached communities.
For a detailed breakdown of how each metric is calculated, see Impact Measurement.
Data freshness
Analytics are calculated in real-time from the underlying distribution records. When a distribution is completed, its weight immediately contributes to the totals. Unfiltered (global) metrics may be cached briefly for performance, but filtered queries always hit live data.